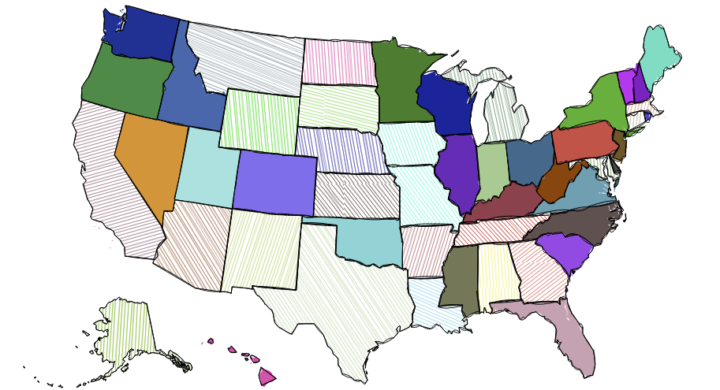
Create graphics with a hand-drawn, sketchy, appearance.
Resource Links
-
Rough.js →
-
Let it flow, let it flow, let it flow →
The particles R package from Thomas Lin Pedersen ports d3-force from d3.js to R. Make a bunch of dots move.
-
Over Heard: A design exploration of the On Being archive →
The process of building a client project with varied expectations along the way.
-
Favourite maps from 2017 →
Cartographer picked his favorites. Better late than never.
-
Automatic label placement along path →
Noah Veltman refined his label placement method, particularly useful for area graphs.
-
2017 Chart Diary →
Adam Pearce, a New York Times graphics editor, provides the notes and thinking behind the charts he made during the year.
-
What Questions to Ask When Creating Charts →
Make charts with a purpose.
-
What Makes a Good Data Scientist at a Small Company →
Being good with data, sure. Then there are other things.
-
World Tile Grid Map in ggplot2 →
A straightforward tutorial on using squares instead of geographic boundaries.
-
R or Python? →
Big community and lots of tools for both.
-
d3-annotation 2.0 →
Next iteration of library for annotation. Made me delve into d3.js v4.
-
How Many Users Resize Their Browser? →
I’ve been slow to get into making things that are responsive. But maybe I should hurry up.
-
How to implement scrollytelling with six different libraries →
A brief look at six libraries to make your charts move as you scroll.
-
A Career Built on Side Projects →
My whole career is a side project.
-
One year as a Data Scientist at Stack Overflow →
Detailed description of what it’s like for someone with a stat-heavy background.
-
One Chart, Twelve Tools →
Using a bunch of different tools to visualize the same dataset in a similar way.
-
Animate gradient to imitate flow with d3.js →
Gain a sense of direction from otherwise static connections.
-
d3.geo.statePlanes →
Nice projections for US states in D3.
-
Wear Patterns →
Naturally occurring visualization in the physical world.
-
What we’ve learned about sharing our data analysis →
“If an article includes our own calculations…then you should be able to see—and potentially criticize—how we did it.”


 Visualize This: The FlowingData Guide to Design, Visualization, and Statistics (2nd Edition)


