Add interaction so that you can show different segments of the data and allow comparisons.
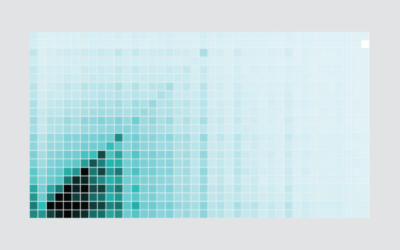
heatmap
-
Members Only
How I Made That: Interactive Heatmap
-
Probably not a heat map
A heat map is a grid of numbers colored by value. I wrote…
-
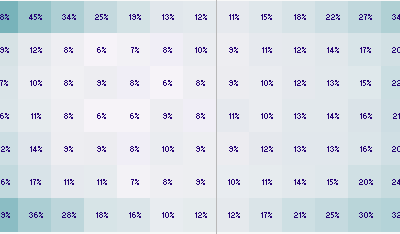
Five years of traffic fatalities
I made a graphic a while back that showed traffic fatalities over a…
-
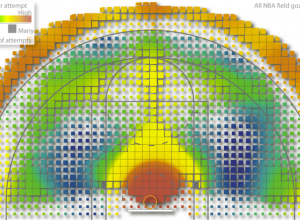
Geography of the basketball court
Kirk Goldsberry, an assistant professor of geography at Michigan State, applies his skills…
-
Optimized dart throwing and other games
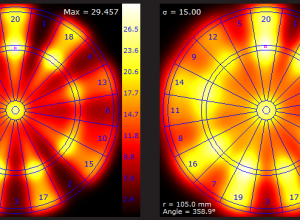
If you play darts just trying to hit the bullseye, you aren’t playing…
-
America is not the best at everything
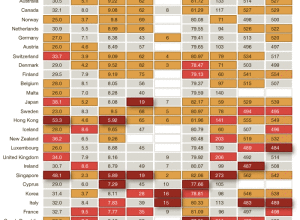
Charles M. Blow has a look at some metrics for the International Monetary…
-
How to Make a Heatmap – a Quick and Easy Solution
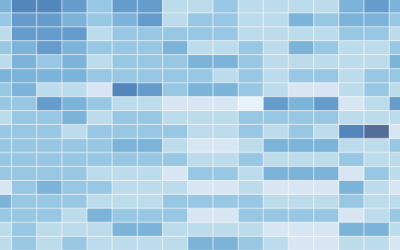
A heatmap is a literal way of visualizing a table of numbers, where you substitute the numbers with colored cells. This is a quick way to make one in R.

 Visualize This: The FlowingData Guide to Design, Visualization, and Statistics (2nd Edition)


