How to Visualize Hierarchical Graphs in R, with ggraph and tidygraph
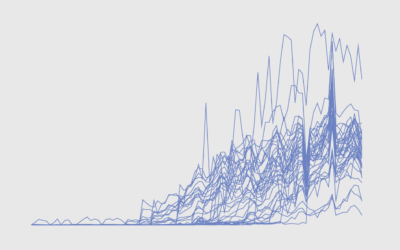
Network graphs are a good way to find structure and relationships within hierarchical data. Here are several ways to do it.
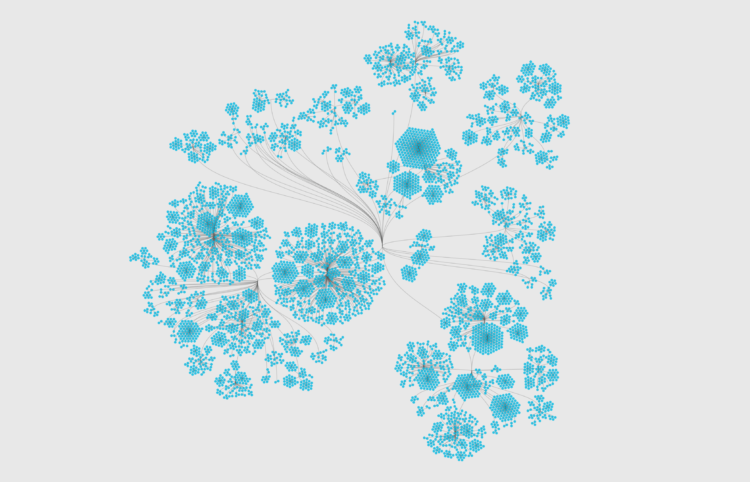
Working with network graph data requires different reasoning and tools than working with tabular data. In tabular data, each each row in the table represents a feature, while in graph data two types of features exist: the nodes of the network, and the edges, which describe the relationships between the nodes.
To access this full tutorial, you must be a member. (If you are already a member, log in here.)
Get instant access to this tutorial and hundreds more, plus courses, guides, and additional resources.
Membership
You will get unlimited access to step-by-step visualization courses and tutorials for insight and presentation — all while supporting an independent site. Files and data are included so that you can more easily apply what you learn in your own work.
Learn to make great charts that are beautiful and useful.
Members also receive a weekly newsletter, The Process. Keep up-to-date on visualization tools, the rules, and the guidelines and how they all work together in practice.
See samples of everything you gain access to:
About the Author
Maarten is a data journalist and data visualization consultant from Belgium. He likes maps, ggplot and a good story.