Interactive network visualizations make it easy to rearrange, filter, and explore your connected data. Learn how to make one using D3 and JavaScript.
D3
-
How to Make an Interactive Network Visualization
-
Link
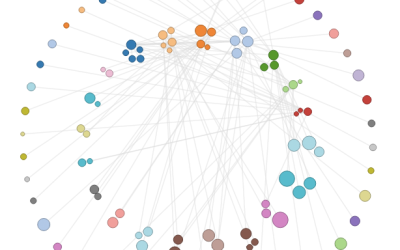
Network Grid →
Force nodes into grid format; see demo
-
Link
Manipulating data like a boss with d3 →
Gotta get it in the right format before you visualize anything
-
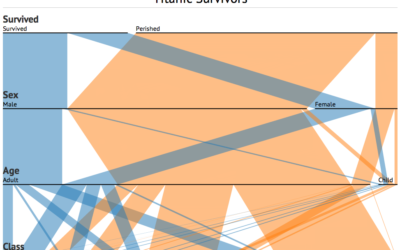
Parallel Sets for categorical data, D3 port
A while back, Robert Kosara and Caroline Ziemkiewicz shared their work on Parallel…
-
Link
Cubism.js →
D3 plugin for visualizing time series
-
Link
D3 and map libraries →
Discussion thread on mapping with the JavaScript library
-
Members Only
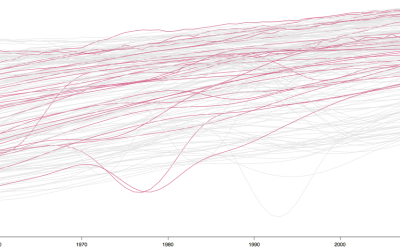
Interactive Time Series Chart with Filters
Time series charts can easily turn to spaghetti when you have multiple categories. By highlighting the ones of interest, you can direct focus and allow comparisons.
-
Live Coding Implemented
Remember Bret Victor’s live coding talk from last month? He presented an example…
-
Interactive and animated word cloud
For those who die a little inside every time they see a word…
-
Members Only
Build Interactive Area Charts with Filters
When you have several time series over many categories, it can be useful to show them separately rather than put it all in one graph. This is one way to do it interactively with categorical filters.
-
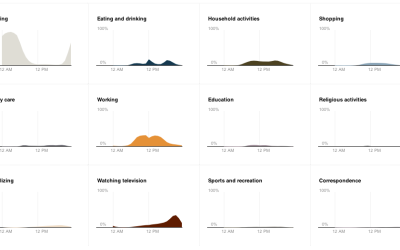
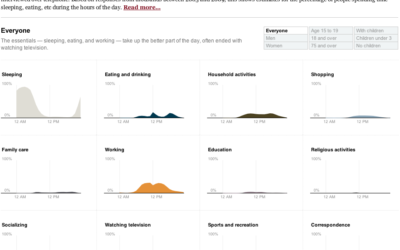
How do Americans spend their days?
One of my favorite data graphics is an interactive piece by The New…


 Visualize This: The FlowingData Guide to Design, Visualization, and Statistics (2nd Edition)


