How to Make an Interactive Network Visualization
Interactive network visualizations make it easy to rearrange, filter, and explore your connected data. Learn how to make one using D3 and JavaScript.
Networks! They are all around us. The universe is filled with systems and structures that can be organized as networks. Recently, we have seen them used to convict criminals, visualize friendships, and even to describe cereal ingredient combinations. We can understand their power to describe our complex world from Manuel Lima’s wonderful talk on organized complexity. Now let’s learn how to create our own.
In this tutorial, we will focus on creating an interactive network visualization that will allow us to get details about the nodes in the network, rearrange the network into different layouts, and sort, filter, and search through our data.
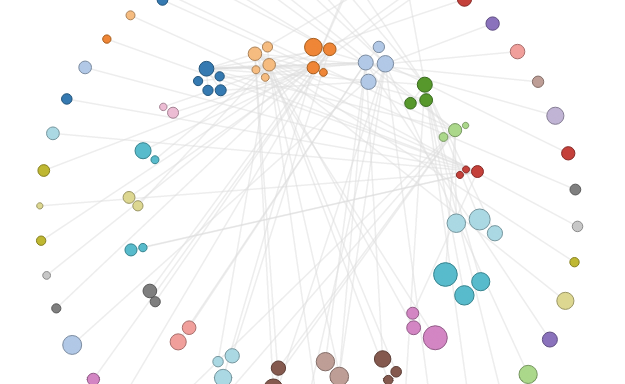
In this example, each node is a song. The nodes are sized based on popularity, and colored by artist. Links indicate two songs are similar to one another.
Try out the visualization on different songs to see how the different layouts and filters look with the different graphs.
Technology
This visualization is a JavaScript based web application written using the powerful D3 visualization library. jQuery is also used for some DOM element manipulation. Both frameworks are included in the js/libs directory of the source code.
If you hate CoffeeScript, you can always compile the code to JavaScript and start there.The code itself is actually written in CoffeeScript, a little language that is easy to learn, and compiles down to regular JavaScript. Why use CoffeeScript? I find that the reduced syntax makes it easier to read and understand what the code is doing. While it may seem a bit intimidating to learn a whole new ‘language’, there are just a few things you need to know about CoffeeScript to be a pro.
Quick CoffeeScript Notes
Functions
First and foremost, This is what a function looks like:
functionName = (input) ->
  results = input * 2
  results
So the input parameters are inside the parentheses. The -> indicates the start of the implementation. If a function’s implementation is super simple, this can all go on one line.
cube = (x) -> x * x * x
A function returns the last thing executed, so you typically don’t need a return statement, but you can use one if you like.
Indentation matters
The other main syntactical surprise is that, similar to Python, indentation is significant and used to denote code hierarchy and scope. We can see an example of this in the function above: The implementation is indented.
In practice, this isn’t too big of an issue: just hit the Tab key instead of using curly braces – {, } – and you are set.
Semicolons and Parentheses
Taking a page from Ruby, semicolons are not needed and should be avoided in CoffeeScript.
Also, parentheses are optional in many places. While this can get confusing, I typically use parentheses unless they are around a multi-line function that is an input argument into another function. If that doesn’t make sense, don’t worry – the code below should still be easy to follow.
For other interesting details, spend a few minutes with the CoffeeScript documentation. You won’t be disappointed.
In-browser CoffeeScript
Using CoffeeScript is made simpler by the fact that our CoffeeScript code can be compiled into JavaScript right in the browser. Our index.html includes the CoffeeScript compiler which in turn compiles to JavaScript any script listed as text/coffeescript :
<script src="js/libs/coffee-script.js"></script>
<script type="text/coffeescript" src="coffee/vis.coffee"></script>
It’s just that simple. When vis.coffee loads, it will be parsed and compiled into JavaScript before running. For production, we would want to do this compilation beforehand, but this let’s us get started right away.
Setting up the Network
You don’t have to organize your code like this, if it seems like too much work. But the encapsulation makes it easier to change your input data laterOk, let’s get started with coding this visualization. We are going to be using a simplified version of Mike Bostock’s (the creator of D3) reusable chart recommendations to package our implementation. What this means for us is that our main network code will be encapsulated in a function, with getters and setters to allow interaction with the code from outside. Here is the general framework:
Network = () ->
  width = 960
  height = 800
  # ...
  network = (selection, data) ->
    # main implementation

  update = () ->
    # private function

  network.toggleLayout = (newLayout) ->
    # public function

  return network
So the Network function defines a closure which scopes all the variables used in the visualization, like width and height. The network function is where the main body of the code goes, and is returned by Network at the end of the implementation.
Functions defined on network, like network.toggleLayout() can be called externally while functions like update are ‘private’ functions and can only be called by other functions inside Network. You can think of it as the same abstraction that classes provide us in object-oriented programing. Here is how we create a new network :
$ ->
  myNetwork = Network()
  # ...

  d3.json "data/songs.json", (json) ->
    myNetwork("#vis", json)
So here, myNetwork is the value Network() returns – namely the function called network. Then we call this network function, passing in the id of the div where the visualization will live, and the data to visualize.
Network Data Format
From above, we see we are passing in the data from songs.json to be visualized. How is this data organized?
Since a network defines connections between nodes as well as the data contained in the nodes themselves, it would be difficult to define as a simple ‘spreadsheet’ or table of values. Instead, we use JSON to capture this structure with as little overhead as possible.
The input data for this visualization is expected to follow this basic structure:</p
{
  "nodes": [
    {
      "name": "node 1",
      "artist": "artist name",
      "id": "unique_id_1",
      "playcount": 123
    },
    {
      "name": "node 2",
      # ...
    }
  ],
  "links": [
    {
      "source": "unique_id_1",
      "target": "unique_id_2"
    },
    {
      # ...
    }
  ]
}
This is a JSON object (just like a JavaScript object). If you haven’t looked at JSON before, then let’s take a look now! The format is pretty straight forward (as it’s just JavaScript).
This object requires two names, nodes and links. Both of these store arrays of other objects. nodes is an array of nodes. Each node object needs some fields used in the visualization as well as an id which uniquely identifies that node.
The objects in the links array just need source and target. Both of these point to @id@’s of nodes.
The traditional/default method in D3 of defining a link’s source and target is to use their position in the nodes array as the value. Since we are going to be filtering and rearranging these nodes, I thought it would be best to use values independent of where the nodes are stored. We will see how to use these id’s in a bit.
Moved by the Force
We will start with the default force-directed layout that is built into D3 . Force-based network layouts are essentially little physics simulations. Each node has a force associated with it (hence the name), which can repel (or attract) other nodes. Links between nodes act like springs to draw them back together. These pushing and pulling forces work on the network over a number of iterations, and eventually the system finds an equilibrium.
Force-directed layouts usually result in pretty good looking network visualizations, which is why they are so popular. D3’s implementation does a lot of work to make the physics simulation efficient, so it stays fast in the browser.
Example of force-directed layout from our song network demo
To start, as is typical with most D3 visualizations, we need to create a svg element in our page to render to. Lets look at the network() function which performs this action:
First we declare a bunch of variables that will be available to us inside the Network closure. They are ‘global’ and available anywhere in Network. Note that our D3 force directed layout is one such global variable called force.
Inside our network function, we start by tweaking the input data. Then we use D3 to append an svg element to the input selection element. linksG and nodesG are group elements that will contain the individual lines and circles used to create the links and nodes. Grouping related elements is a pretty common strategy when using D3. Here, we create the linksG before the nodesG because we want the nodes to sit on top of the links.
The update function is where most of the action happens, so let’s look at it now.
  # The update() function performs the bulk of the
  # work to setup our visualization based on the
  # current layout/sort/filter.
  #
  # update() is called everytime a parameter changes
  # and the network needs to be reset.
  update = () ->
    # filter data to show based on current filter settings.
    curNodesData = filterNodes(allData.nodes)
    curLinksData = filterLinks(allData.links, curNodesData)

    # sort nodes based on current sort and update centers for
    # radial layout
    if layout == "radial"
      artists = sortedArtists(curNodesData, curLinksData)
      updateCenters(artists)

    # reset nodes in force layout
    force.nodes(curNodesData)

    # enter / exit for nodes
    updateNodes()

    # always show links in force layout
    if layout == "force"
      force.links(curLinksData)
      updateLinks()
    else
      # reset links so they do not interfere with
      # other layouts. updateLinks() will be called when
      # force is done animating.
      force.links([])
      # if present, remove them from svg
      if link
        link.data([]).exit().remove()
        link = null

    # start me up!
    force.start()
The final version of this visualization will have filtering and sorting capabilities, so update starts with filtering the nodes and links of the total dataset. Then sorts if necessary. We will come back and hit these functions later. For the basic force-directed layout without all these bells and whistles to come, all we really care about is:
force.nodes(curNodesData)
updateNodes()

force.links(curLinksData)
updateLinks()
The force’s nodes array is set to our currently displayed nodes, erasing any previous nodes in the simulation. Then we update the visual display of the nodes in the visualization. This same pattern is then followed for the links.
Remember: the force layout doesn’t add circles and lines for you. It just tells you where to put them.It is important to realize that in D3, the nodes and links in the force layout don’t automatically get visualized in any way. This is to say that there is a separation between the force-directed physics simulation and any visual mapped to that simulation.
To create this visual representation associated with this force-directed simulation, we will need to bind to the same data being used, which we do in updateNodes and updateLinks:
  # enter/exit display for nodes
  updateNodes = () ->
    node = nodesG.selectAll("circle.node")
      .data(curNodesData, (d) -> d.id)

    node.enter().append("circle")
      .attr("class", "node")
      .attr("cx", (d) -> d.x)
      .attr("cy", (d) -> d.y)
      .attr("r", (d) -> d.radius)
      .style("fill", (d) -> nodeColors(d.artist))
      .style("stroke", (d) -> strokeFor(d))
      .style("stroke-width", 1.0)

    node.on("mouseover", showDetails)
      .on("mouseout", hideDetails)

    node.exit().remove()

  # enter/exit display for links
  updateLinks = () ->
    link = linksG.selectAll("line.link")
      .data(curLinksData, (d) -> "#{d.source.id}_#{d.target.id}")
    link.enter().append("line")
      .attr("class", "link")
      .attr("stroke", "#ddd")
      .attr("stroke-opacity", 0.8)
      .attr("x1", (d) -> d.source.x)
      .attr("y1", (d) -> d.source.y)
      .attr("x2", (d) -> d.target.x)
      .attr("y2", (d) -> d.target.y)

    link.exit().remove()
Finally, some D3 visualization code! Looking at updateNodes, we select all circle.node elements in our nodeG group (which at the very start of the execution of this code, will be empty). Then we bind our filtered node data to this selection, using the data function and indicating that data should be identified by its id value.
The enter() function provides an access point to every element in our data array that does not have a circle associated with it. When append is called on this selection, it creates a new circle element for each of these representation-less data points. The attr and style functions set values for each one of these newly formed circles. When a function is used as the second parameter, like:
.attr("r", (d) -> d.radius)
The d is the data associated with the visual element, which is passed in automatically by D3. So with just a few lines of code we create and style all the circles we need.
Because we will be filtering our data to add and remove nodes, there will be times where there is a circle element that exists on screen, but there is no data behind it. This is where the exit() function comes into play. exit() provides a selection of elements which are no longer associated with data. Here we simply remove them using the remove function.
If the concepts of enter() and exit() are still not clicking, check out the Thinking With Joins and three little circles tutorials. These selections are a big part of D3, so it is worth having a feel for what they do.
Configuring the Force
There has to be a ton of Star Wars jokes I should be making… but I can’t think of any.In order to get the force-directed graph working the way we want, we need to configure the force layout a bit more. This will occur in the setLayout function. For the force-directed layout, our force configuration is pretty simple:
force.on("tick", forceTick)
.charge(-200)
.linkDistance(50)
Here, charge is the repulsion value for nodes pushing away from one another and linkDistance is the maximum length of each link. These values allow the nodes to spread out a bit.
The forceTick function will be called each iteration (aka ‘tick’) of the simulation. This is where we need to move our visual representations of the nodes and links of the network to where they are in the simulation after this tick. Here is forceTick:
  # tick function for force directed layout
  forceTick = (e) ->
    node
      .attr("cx", (d) -> d.x)
      .attr("cy", (d) -> d.y)

    link
      .attr("x1", (d) -> d.source.x)
      .attr("y1", (d) -> d.source.y)
      .attr("x2", (d) -> d.target.x)
      .attr("y2", (d) -> d.target.y)
Pretty straightforward. The D3 simulation is modifying the x and y values of each node during the simulation. Thus, for each tick, we simply need to move the circles representing our nodes to where x and y are. The links can be moved based on where their source and target nodes are.
Setting Up Data
Speaking of source and target, we need to go back and see how to deal with our initial data where we were using the id of a node in place of the node’s index in the nodes array. Here is setupData which is the very first thing executed in our network code:
  # called once to clean up raw data and switch links to
  # point to node instances
  # Returns modified data
  setupData = (data) ->
    # initialize circle radius scale
    countExtent = d3.extent(data.nodes, (d) -> d.playcount)
    circleRadius = d3.scale.sqrt().range([3, 12]).domain(countExtent)

    data.nodes.forEach (n) ->
      # set initial x/y to values within the width/height
      # of the visualization
      n.x = randomnumber=Math.floor(Math.random()*width)
      n.y = randomnumber=Math.floor(Math.random()*height)
      # add radius to the node so we can use it later
      n.radius = circleRadius(n.playcount)

    # id's -> node objects
    nodesMap  = mapNodes(data.nodes)

    # switch links to point to node objects instead of id's
    data.links.forEach (l) ->
      l.source = nodesMap.get(l.source)
      l.target = nodesMap.get(l.target)

      # linkedByIndex is used for link sorting
      linkedByIndex["#{l.source.id},#{l.target.id}"] = 1

    data
setupData is doing a few things for us, so let’s go through it all. First, we are using a d3.scale to specify the possible values that the circle radii can take, based on the extent of the playcount values. Then we iterate through all the nodes, setting their radius values, as well as setting their x and y values to be within the current visualization size. Importantly, nodes are not automatically sized by any particular data value they contain. We are just adding radius to our data so we can pull it out in updateNodes. The x and y initialization is just to reduce the time it takes for the force-directed layout to settle down.
Finally, we map node id’s to node objects and then replace the source and target in our links with the node objects themselves, instead of the id’s that were in the raw data. This allows D3’s force layout to work correctly, and makes it possible to add/remove nodes without worrying about getting our nodes array and links array out of order.
Radializing the Force
Now we have everything needed to display our network in a nice looking, fast, force-directed layout. It might have been a lot of explanation, but we did it in a pretty small amount of code.
The force-directed layout is a great start, but also a bit limiting. Sometimes you want to see your network in a different layout – to find patterns or trends that aren’t readily apparent in a force-directed one. In fact, it would be really cool if we could toggle between different layouts easily – and allow our users to see the data in a number of different formats. So, lets do that!
Here’s a basic idea: we are going to hijack D3’s force-directed layout and tell it where we want the nodes to end up. This way, D3 will still take care of all the physics and animations behind the scenes to make the transitions between layouts look good without too much work. But we will get to influence where the nodes go, so their movements will no longer be purely based on the underlying simulation.
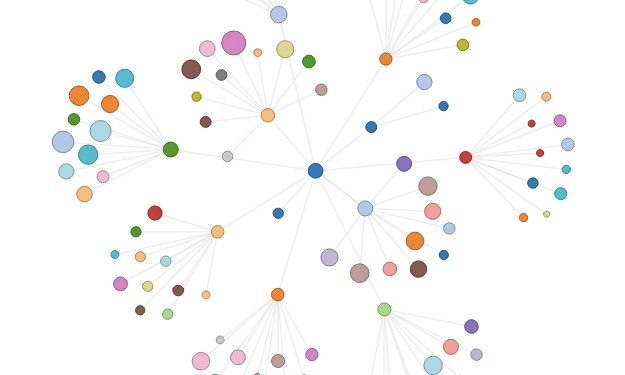
Radial layout example, grouping song nodes by artist
Always force-jack with extreme cautionTo aid in our force-jacking, I’ve created a separate entity to help position our nodes in a circular fashion called RadialPlacement. Its not really a full-on layout, but just tries to encapsulate the complexity of placing groups of nodes. Essentially, we will provide it with an array of keys. It will calculate radial locations for each of these keys. Then we can use these locations to position our nodes in a circular fashion (assuming we can match up our nodes with one of the input keys).
RadialPlacement is a little clumsy looking, but gets the job done. The bulk of the work occurs in setKeys and radialLocation :
# Help with the placement of nodes
RadialPlacement = () ->
  # stores the key -> location values
  values = d3.map()
  # how much to separate each location by
  increment = 20
  # how large to make the layout
  radius = 200
  # where the center of the layout should be
  center = {"x":0, "y":0}
  # what angle to start at
  start = -120
  current = start

  # Given a set of keys, perform some
  # magic to create a two ringed radial layout.
  # Expects radius, increment, and center to be set.
  # If there are a small number of keys, just make
  # one circle.
  setKeys = (keys) ->
    # start with an empty values
    values = d3.map()

    # number of keys to go in first circle
    firstCircleCount = 360 / increment

    # if we don't have enough keys, modify increment
    # so that they all fit in one circle
    if keys.length < firstCircleCount       increment = 360 / keys.length     # set locations for inner circle     firstCircleKeys = keys.slice(0,firstCircleCount)     firstCircleKeys.forEach (k) -> place(k)

    # set locations for outer circle
    secondCircleKeys = keys.slice(firstCircleCount)

    # setup outer circle
    radius = radius + radius / 1.8
    increment = 360 / secondCircleKeys.length

    secondCircleKeys.forEach (k) -> place(k)

  # Gets a new location for input key
  place = (key) ->
    value = radialLocation(center, current, radius)
    values.set(key,value)
    current += increment
    value

  # Given an center point, angle, and radius length,
  # return a radial position for that angle
  radialLocation = (center, angle, radius) ->
    x = (center.x + radius * Math.cos(angle * Math.PI / 180))
    y = (center.y + radius * Math.sin(angle * Math.PI / 180))
    {"x":x,"y":y}
Hopefully the comments help walk you through the code. In setKeys our goal is to break up the total set of keys into an inner circle and an outer circle. We use slice to pull apart the array, after we figure out how many locations can fit in the inner circle.
radialLocation does the actual polar coordinate conversion to get a radial location. It is called from place, which is in turn called from setKeys.
Toggling Between Layouts
Lets the user explore different layouts interactively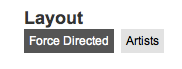
With RadialPlacement in tow, we can now create a toggle between our force-directed layout and a new radial layout. The radial layout will use the song’s artist field as keys so the nodes will be grouped by artist.
In the update function described above, we saw a mention of the radial layout:
 if layout == "radial"
      artists = sortedArtists(curNodesData, curLinksData)
      updateCenters(artists)
Here, sortedArtists provides an array of artist values sorted by either the number of songs each artist has, or the number of links. Let’s focus on updateCenters, which deals with our radial layout:
  updateCenters = (artists) ->
    if layout == "radial"
      groupCenters = RadialPlacement().center({"x":width/2, "y":height / 2 - 100})
        .radius(300).increment(18).keys(artists)
We can see that we just pass our artists array to the RadialPlacement function. It calculates locations for all keys and stores them until we want to position our nodes.
Now we just need to work on this node positioning and move them towards their artist’s location. To do this, we change the tick function for the D3 force instance to use radialTick when our radial layout is selected:
  # tick function for radial layout
  radialTick = (e) ->
    node.each(moveToRadialLayout(e.alpha))

    node
      .attr("cx", (d) -> d.x)
      .attr("cy", (d) -> d.y)

    if e.alpha < 0.03       force.stop()       updateLinks()   # Adjusts x/y for each node to   # push them towards appropriate location.   # Uses alpha to dampen effect over time.   moveToRadialLayout = (alpha) ->
    k = alpha * 0.1
    (d) ->
      centerNode = groupCenters(d.artist)
      d.x += (centerNode.x - d.x) * k
      d.y += (centerNode.y - d.y) * k
We can see that radialTick calls moveToRadialLayout which simply looks up the location for the node’s artist location from the previously computed groupCenters. It then moves the node towards this center.
This movement is dampened by the alpha parameter of the force layout. alpha represents the cooling of the physics simulation as it reaches equilibrium. So it gets smaller as the animation continues. This dampening allows the nodes repel forces to impact the position of the nodes as it nears stopping – which means the nodes will be allowed to push away from each other and cause a nice looking clustering effect without node overlap.
We also use the alpha value inside radialTick to stop the simulation after it has cooled enough and to have an easy opportunity to redisplay the links.
Because the nodes are different sizes, we want them to have different levels of repelling force to push on each other with. Luckily, the force’s charge function can itself take a function which will get the current node’s data to calculate the charge. This means we can base the charge off of the node’s radius, as we’ve stored it in the data:
charge = (node) -> -Math.pow(node.radius, 2.0) / 2
The specific ratio is just based on experimentation and tweaking. You are welcome to play around with what other effects you can come up with for charge.
Filter and Sort
Force-directed and Radial layouts after filtering for obscure songs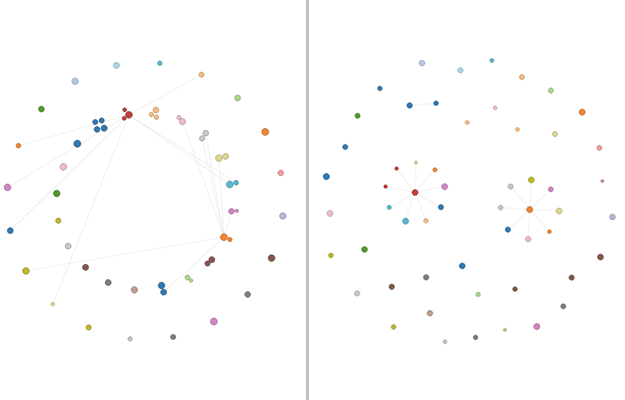
The filter and sort functionality works how you would expect: we check the networks current setting and perform operations on the nodes and links based on these settings. Let’s look at the filter functionality that deals with popular and obscure songs, as it uses a bit of D3 array functionality:
  # Removes nodes from input array
  # based on current filter setting.
  # Returns array of nodes
  filterNodes = (allNodes) ->
    filteredNodes = allNodes
    if filter == "popular" or filter == "obscure"
      playcounts = allNodes.map((d) -> d.playcount).sort(d3.ascending)
      # get median value
      cutoff = d3.quantile(playcounts, 0.5)

      filteredNodes = allNodes.filter (n) ->
        if filter == "popular"
          n.playcount > cutoff
        else if filter == "obscure"
          n.playcount
    filteredNodes
filterNodes defaults to returning the entire node array. If popular or obscure is selected, it uses D3’s quantile function to get the median value. Then it filters the node array based on this cutoff. I’m not sure if the median value of playcounts is a good indicator of the difference between ‘popular’ and ‘obscure’, but it gives us an excuse to use some of the nice data wrangling built into D3.
Bonus: Search
Search bar – Simple searching made easy
Search is a feature that is often needed in networks and other visualizations, but often lacking. Given a search term, one way to make a basic search that highlights the matched nodes would be:
  # Public function to update highlighted nodes
  # from search
  network.updateSearch = (searchTerm) ->
    searchRegEx = new RegExp(searchTerm.toLowerCase())
    node.each (d) ->
      element = d3.select(this)
      match = d.name.toLowerCase().search(searchRegEx)
      if searchTerm.length > 0 and match >= 0
        element.style("fill", "#F38630")
          .style("stroke-width", 2.0)
          .style("stroke", "#555")
        d.searched = true
      else
        d.searched = false
        element.style("fill", (d) -> nodeColors(d.artist))
          .style("stroke-width", 1.0)
We just create a regular expression out of the search, then compare it to the value in the nodes that we want to search on. If there is a match, we highlight the node. Nothing spectacular, but its a start to a must-have feature in network visualizations.
We can see that updateSearch is a public function, so how do we connect it to the UI on our network visualization code?
Wiring it Up
The other button groups use very similar code.There are a lot of ways we could connect our buttons and other UI to the network functionality. I’ve tried to keep things simple here and just have a separate section for each button group. Here is the layout toggling code:
  d3.selectAll("#layouts a").on "click", (d) ->
    newLayout = d3.select(this).attr("id")
    activate("layouts", newLayout)
    myNetwork.toggleLayout(newLayout)
So we simply active the clicked button and then call into the network closure to switch layouts. The activate function just adds the active class to the right button.
Our search is pretty similar:
  $("#search").keyup () ->
    searchTerm = $(this).val()
    myNetwork.updateSearch(searchTerm)
It just uses jQuery to watch for a key-up event, then re-runs the updateSearch function.
Thanks and Goodnight
Hopefully we have hit all the highlights of this visualization. Interactive networks are a powerful visual, and this code should serve as a jumping off point for your own amazing network visualizations.
Other placement functions could be easily developed for more interesting layouts, like spirals, sunflowers, or grids. Filtering and sorting could be extended in any number of ways to get more insight into your particular dataset. Finally, labelling could be added to each node to see what is present without mousing over.
I hope you enjoyed this walk-through, and I can’t wait to see your own networks!
Made possible by FlowingData members.
Become a member to support an independent site and learn to make great charts.
About the Author
Jim Vallandingham is a programmer and data analyst currently working in the Nordstrom Data Lab as a data visualization engineer. He is interested in interactive interfaces to data that allow for exploration and insight. You can find him on Twitter @vlandham and his personal site, vallandingham.me.
54 Comments
Add Comment
You must be logged in and a member to post a comment.
what needs to be done to get this library to work with ie8
Unfortunately, D3 is only really made to work on modern browsers.
I’ve seen some starts at using Raphael as a backend to D3 – which would provide support for IE8. See d34raphael:
http://webmonarch.github.com/d34raphael/
But I haven’t tried this approach, so I don’t really know how far along the implementation is.
Nice post! Great to see some code on the site and demonstration for creating a graph. VivaGraphJS is another JS force graph that I’ve used recently. I choose it over D3 in this instance – very simple to use. https://github.com/anvaka/VivaGraphJS
Thanks Jeff!
VivaGraphJS looks like a great option. Other JS based network tools include:
sigmaJS: http://sigmajs.org/
arborJS: http://arborjs.org/introduction
I wish D3 had integrated support for pan/zoom. Seems like such a common thing that requires looking all over for examples. Another one that I thought was more difficult that it should have been was simply using pictures instead of ellipses.
Jeff,
there certainly is a cost with using a lower level library like D3.
D3 does have the zoom behavior – which can help with your first issue:
https://github.com/mbostock/d3/wiki/Zoom-Behavior
Though it is a bit tricky to get working (for me at least). This Stack Overflow post tackles the issue:
http://stackoverflow.com/questions/7871425/is-there-a-way-to-zoom-into-a-graph-layout-done-using-d3
I’ve never attempted images as nodes, but I think it would be done using SVG groups and the SVG image element:
http://apike.ca/prog_svg_images.html
Hi Jim,
nice demo. If you don’t mind me asking, to see my own data, how and what do I need to do to get my own data to load in your demo app?
thanks
-s
Thanks simon,
You should be able to download the source from the link above.
Check out the data/ directory inside the zip, and you can see the format the data for these networks are in.
Should be just json with a ‘nodes’ array and a ‘links’ array.
Since the app groups by ‘artist’, if you want to group by another field, you would need to change that in the code.
Hi Jim,
Thanks for the tip on the groups.
Can I ask what do you use to generate those the text data files?
thanks
-s
when i download the source and open the index file in firefox the buttons load but the graph doesn’t.
do i need to do something extra to get it to run?
Hi Marion,
Due to the way D3 pulls in data, you typically need to run the site from a local webserver. I apologize for not including a README in the download to explain this. I believe I created one, but must have missed it in the zip file.
If you have python installed (which should be true for Mac and Linux systems) you can run python’s simple http server by running the following command in the terminal:
python -m SimpleHTTTPServer -p 3000
If you have ruby installed, you can get the ‘thin’ web server gem, and then run:
thin start
inside the tutorial directory. In both cases, you should be able to open up
http://0.0.0.0:3000
and see the visualization.
Sorry again for the oversight of not adding these instructions. Please let me know if you have any problems with this.
still need help. i really have no idea what i’m doing, i think i’m way out of my depth…
I downloaded python for windows but when i try to run the server command i just get syntax errors. is this because i’m using version 3.2.3 rather than 2, or is there just something else i need to do as well?
Marion,
I don’t have a ton of experience with getting a webserver up and going on Windows. If you want to post the errors you are getting somewhere, I can look at them.
According to this stackoverflow.com question:
http://stackoverflow.com/questions/530787/simple-http-web-server
python 3 might have a slightly different syntax to get working:
python -m http.server
Thanks,
Jim
oh yes, the new syntax worked, thank you! (it took me a while to realise that i had to run it in cmd without running the interpreter first)
i’ve now got the demo vis to run in my browser, thanks so much!
now it remains to see if i can create one of my own…
Hi Jim,
This demo is much appreciated.
I’m running on Windows and haven’t been able to update nodes and adding new nodes and graphs of my own. The demo renders, and I see the names of my new graphs in the song selection menu. After updating the graph .json and songs.json, however, my new graphs still don’t render. The terminal window also shows a string of 200 and 404 messages.
I haven’t been able to trace the code execution flow very well or determine where my new .jsons are being read, etc. (this is probably my inexperience with JS). Any insight on that is also appreciated.
Thanks, Jim,
-Michael
Hi Michael,
Sounds like an interesting issue. I don’t have a lot of developing on Windows experience, but from it sounds like, this probably isn’t a Windows-specific problem.
Error messages in the terminal would imply a problem not necessarily related to the javascript code. The only problem that I can think of that would cause errors in the terminal would be when the server itself cannot find a resource it is trying to access.
Is it possible that the path to your new song .json file is incorrect – or incomplete?
If this is not the case, are any errors or warning messages presented in your web browser’s console? In Google Chrome, you can access the console by selecting View -> Developer -> JavaScript Console.
Have the console open. Reload the page, then select your new entry again, to see if any errors are displayed.
If this troubleshooting leads to a dead end, you might need to post some of your code changes, or some of the error messages you are receiving.
https://gist.github.com/
would be one option for sharing this code/error messages.
Thanks
Jim
Simon,
I used a sloppy ruby script to get the data into this format.
You can see it in the tools/ directory of the sample code.
Any simple data structure made of hashes and arrays can be converted into json without too much work.
Below is a code snippet I like to use that makes the output easy to read:
File.open(output_filename, ‘w’) do |file|
file.puts JSON.pretty_generate(JSON.parse(data.to_json))
end
Hi Jim,
This is great. Thanks again.
best
-s
Hi Jim,
Fantastic code! However, I’m struggling to add a new layout grouping. I want to group the nodes in a radial manner but by a different element
I’ve added a new if statement
if layout == “radial2” #I’ve changed the name of the ‘id’ in the html
artists2 = sortedArtists(curNodesData, curLinksData)
updateCenters(artists2)
# reset nodes in force layout
force.nodes(curNodesData)
# enter / exit for nodes
updateNodes()
I’ve added the following:
updateCenters = (artists2) ->
if layout == “radial2”
groupCenters = RadialPlacement().center({“x”:width/2, “y”:height / 2 – 100})
.radius(300).increment(18).keys(artists2)
Is this the correct way of initiating a new radial layout that references another value in the JSON?
I’m also baffled as to what I ammend in the tick function.
Any help would be awesome! I’ve hit a brickwall.
Hi Tim,
Glad you enjoyed the tutorial. Sorry you are getting stuck.
I think you have the start of one way to add a new layout grouping, but have some issues. For one, it would appear you now have 2 different functions with the name updateCenters, that both take the same number of arguments. This should not work, as the system won’t know which to choose.
If you are really wanting to use a radial layout – but with a different grouping besides ‘artist’ – I have an alternative approach to suggest: You can abstract out the value used to group the bubbles to its own little function, then just change the function to return whatever value you want to group by.
I’ve created a small github repo with a method for doing this – so we can easily see the changes required. Here is the changes needed to move the decision of which value to group the nodes by into its own function:
https://github.com/vlandham/network_vis_variant/commit/0055c48741fa743dc2957ce7771336ade33ec84a
The function is called ‘groupBy’ and it is at the top of the Network function. Then say we had another value, ‘year’, that we wanted to group by instead. Now its as easy as changing the return value of the groupBy function:
https://github.com/vlandham/network_vis_variant/commit/15ba04a7f93472f2b54d8fb7453a7779c4a89559
The rest of the code can remain the same. If you want to toggle between grouping by artist and year, you can simply add a setter for this groupBy function, or the value it returns.
Let me know if this solution won’t work for you, or if you need a more complete example.
Thanks,
Jim
Jim,
Awesome code! Hugely helpful.
So I made the changes you suggested, such that anything that follows d. will be the JSON value by which the nodes are grouped i.e.
groupBy = (d) ->
d.type
I was wondering if you could help once more and tell me how I can make the d.VALUE dynamic. So basically if I added a Group By in the index.html file……how could I activate that and read the “id” of the selected tag so that …………… d.valueofselectedgroupbyoption/
I hope this makes sense. To summarize I basically want to add a drop down menu where a user can selected how they want the radial layout to group the nodes i.e. by genre or by year published. This value will then append the n.artist (where artist is the value replaced).
Many Thanks in advance and apologies for the stupidity!
Tim
Glad it was useful.
To dynamically change the grouping method, we can pretty much follow the system used by the other controls: make a public function to change the grouping value and then provide some UI to trigger that function.
Here’s a diff to our last code set that does just that:
https://github.com/vlandham/network_vis_variant/commit/73df7cbe820d314d47cea2a27f7cd33f2cd1c310
You can see that I’m just replacing the groupBy function with another one, based on the toggle selected. This is just one quick way to make this switch.
hope this gets you going on your own network.
Jim
Hi guys–
Like Simon, I am having trouble getting my data into the right JSON structure. I’m trying to export a Gephi graph CSV, then use Mr.DataConverter to turn it into a JSON which seems to be working however, what I can’t figure out is how to supplement my own node attributes.
For example, each one of your nodes have attributes of “name”, “artist”, “id”, “playcount”
/*
“nodes”: [
{
“name”: “node 1”,
“artist”: “artist name”,
“id”: “unique_id_1”,
“playcount”: 123
},
*/
However my node attributes, instead of having “name”, “artist”, etc…
they have “Id”, “Label”, “sex”, “wall count” and more…
/*
“nodes” : [
{
“Id”:1672,
“Label”:”Austen Phillips Cruz”,
“sex”:”female”,”wallcount”:243,
“declarative_intensity”:126
},
*/
So, do I have to tell d3 that instead of “name” i am using “Label”?
If so, how/where is that done.
Thanks so much for the great tutorial. Keep em coming!
WeeezzzyyyF
Hi Zack.
To use your own node structure, I believe a good start would be to follow this line of changes:
* First, incorporate the changes I detail for Tim above, that abstract away the use of ‘artist’ directly – and instead allow for a custom value from the nodes to be used.
Here are links to the same gist that should let you accomplish this task:
https://github.com/vlandham/network_vis_variant/commit/0055c48741fa743dc2957ce7771336ade33ec84a
And then in the ‘groupBy’ function, use the node attribute you are interested in grouping by – like ‘Label’. As an aside, in javascript, you can use an array-like syntax to access values in an object – so you could write:
groupBy = (d) ->
d[“Label”]
to group by a node’s ‘Label’ attribute.
In the code, I use an attribute called ‘id’ to uniquely access each node. This is used by the ‘mapNodes’ function to associate nodes with their appropriate links, as well as in a number of different places. In your node example, it looks like you are using ‘Id’ – with a capital ‘I’.
Perhaps the easiest way to get around this would be to add an ‘id’ attribute that mirrors your ‘Id’ to each node, before any other work occurs in the visualization. This can be done in the ‘setupData’ function. We already are iterating through each node to provide an initial x/y value, so you could add something like:
data.nodes.forEach (n) ->
n.id = n[“Id”]
# rest of the loop here
That way you won’t have to worry about changing all those ‘id”s to ‘Id”s in the code.
To switch ‘name’ to ‘Label’ a quick find and replace should work. OR you can add ‘name’ into your nodes – just like ‘id’ in the setupData function:
data.nodes.forEach (n) ->
n.name = n[“Label”]
# rest of the loop here
So its really a trade off between modifying the code to accomodate your node structure, or modifying your node structure to accomodate the code.
The later might be easier then the former, and would probably incur a very minimal amount of delay in the rendering of the visualization (the slow step isn’t the preprocessing – its the creation of the nodes).
Hope this gets you on the right track for creating your own network visualizations with this example.
Thanks!
Jim
Hi Jim,
I keep saying this but genuinely thank you for your help! I have now got me quite a nice network up and running.
In fact it’s almost working exactly as I’d planned but I’d love to be able to implement a couple of additional features and any input would be greatly appreciated….I’ll even promise to pest no more!
Firstly, I was hoping to add direction to the relationships (inbound/ outbound/bi-directional). I was wondering if I’d simply add this information to each edge in the JSON file? Once this information has been added I was wondering how I would go about adding arrow heads to the connecting lines?
Secondly, I was hoping to represent frequency of ‘knowledge flowing between nodes’ and thought the best way would be to have varied width lines between the nodes or have use a grayscale for the lines colour. Could you advise on how I could go about implementing this?
Any input would be super appreciated!
Thanks as ever
Tim
Hi Tim,
Glad you are getting some results for your visualization!
To answer your edge questions:
Yes, you should be able to add more attributes to each edge in the json file and then use this information to determine how to visualize the edges.
The edges are, in fact, already directional – each edge has a source and a destination. So you have two options: you could use this built in directionality directly, or you could add a separate attribute to each of your edges to indicate directionality.
I myself would lean towards using the first approach, as it is cleaner and more direct. If you need to support bi-directional edges, you could add a separate edge for each direction. This may or may not have the look you are wanting. If you want to keep bi-directional-ness to a single edge, you could still use the built in directionality of edges and then just have an extra attribute – ‘bidirectional’ that would be true or false.
Once you have the data in place, adding the arrow heads looks to be a bit more tricky.
Here is an example using arrow heads, as well as different types of lines in a network visualization in d3:
http://bl.ocks.org/1153292
It might take a bit of study and experimentation to get it working in your project, but I think it is doable. I believe in this example, the different arrow types are created separately and then used as the end markers of the lines by linking to their url.
I’d suggest getting a local copy of this example working and then trying to copy over the functionality to your graphic.
You can see how the different line types are done using css. Your grayscale lines could be accomplished the same way.
Jim
Hi (again)
How can i generate a JSON file from data on a website (ideally without copying and pasting manually)?
Hi Marion,
Well, in fact there are many, many ways to do this – depending on the website in question, the data you want, and the tools you have available.
If we are talking about ‘scraping’ the data from the website, there are python and ruby packages to pull data from html:
* http://nokogiri.org/
* http://scrapy.org/
Personally, one of my favorite pass-times as of late is using the Javascript debugger built into the Chrome web browser to pull data directly from a website.
I haven’t seen any comprehensive documentation about how to do this, but I really like this tutorial from Tom MacWright which uses jquery:
http://macwright.org/2012/09/06/scrapers.html
Hopefully these links help. Web scraping is quite a large topic.
You might also check out:
https://scraperwiki.com/
and http://phantomjs.org/
Hey, this is a bit of a tangent, however, a network visualization related question….
Does anyone know how to acces public Facebook page data? Like Obama or Absolut Vodka, or Nike etc…
I’ve toyed around with Facebook’s GraphAPI, however, you can only get 100 results per request which is pointless.
I mean, the data is public. Just how to get it…….
thx. weeezzzyyy
Sorry. I’m not familiar with ways to get this data out.
Hope you find a solution!
Hi Jim,
Thanks for all your help so far! I’ve got a rich visualization that’s close to completion with lots of groupBy functionality and on the whole it’s very swell! However I’ve amassed a few questions that I’d love to swing your way to get your feedback!
1. I was hoping to add a new search field where you can search for all nodes based on another attribute i.e. year of release, how would I go about setting up this new search field and setting what JSON field it should be searching through?
2. Is their a maximum size (no of nodes) the visualization will accept before crashing? I’m making a JSON file from DB queries which are then written to JSON format using jsencode. 50% of the time the files open no problem, however for the larger files there tends to be problems. The error I get in the console reads as follows:
Uncaught TypeError: Cannot read property ‘id’ of undefined
If you can offer an insight on my queries it would be much appreciated as ever!
Cheers
Tim
Hi Tim.
Glad you are making progress with your visualization.
For your additional search – question #1 – you could do this a couple different ways. One way would be to duplicate the ‘search_section’ portion of index.html to have two search forms.
I would switch to using a ‘.search’ class instead of a search id – so you can use the same stylings for both searches. Then you could pass the field you are searching for (‘name’ or ‘year’) as a second parameter to the network’s search.
I’ve created a gist here that tries to capture the changes that would be required. Note that this is untested code, but should point you in the right direction:
https://gist.github.com/3811943
Also note that you would need to modify the css for the search box to make them use the class names instead of id’s.
If you were planning on just searching for year’s you might consider a drop down list – with all possible years listed, instead of just a text box.
For issue #2 – This doesn’t sound like a problem with the number of nodes. Instead, it sounds like somewhere in the visualization there is an issue of passing a bad node (an undefined node) to a function that is trying to access the ‘id’ parameter of the node. Since the node here is undefined, it gives this error.
What would cause an undefined node? Well, I would start by looking at the mapping we use to connect the links to the nodes.
If you recall from the tutorial, we are using the ‘id’ field of the node to reference specific nodes in the ‘links’ section of our json data files. So, if you had a typo, or mismatch in one of your id’s used in the links section compared to the node id’s, then this mapping would be unsuccessful, and you would end up with links with no actual nodes associated with them.
So in short, check your links and make sure that all the id’s in the ‘source’ and ‘target’ sections have corresponding nodes with the same ids.
In the network.updateData function, you could add some console logs to see that each link gets a source and target node
# switch links to point to node objects instead of id’s
data.links.forEach (l) ->
console.log(l.source)
console.log(l.target)
l.source = nodesMap.get(l.source)
l.target = nodesMap.get(l.target)
console.log(l.source)
console.log(l.target)
The first set of console.logs should output id’s. The second set should output node Objects. If you see an ‘undefined’ listed, then you will have your problem node.
Hope this helps and I hope we get to see your finished project!
Hey Jim, I’ve been following Tim’s question as I have also been having some difficulty trying to add an additional search box but I managed to get it working today using your code – Thanks! One thing I’d like to do is get the information from the JSON into another div on the index page. Looking at your code for the tooltip has been useful but I can’t work out the process involved in trying to get info from the JSON into a different div. If you have any thoughts on how I could go about achieving this, I’d be really grateful!
Hi Layla,
Glad you are making progress.
I can give a small example of how you might add a separate ‘info’ div to the index page in order to display information.
I’ve created a gist that tries to explain the basic steps needed to add this div:
https://gist.github.com/3829989
First, we add an empty div with the id of ‘info’ to index.html. I just added it below the vis div:
https://gist.github.com/3829989#file_index.html
I’ll assume that you want to change the contents of the div when a particular node is clicked. In order to do this, we will create a new function ‘showInfo’ and bind it to the node’s click signal:
https://gist.github.com/3829989#file_node_click_vis.coffee
This showInfo function will have access to all the json data for that particularly clicked node as one of its input parameters. The idea for this function is to build up the html content we want to display (as in the tool tip) and then use d3’s ‘html’ function to replace the contents of the ‘#info’ div with this new content.
https://gist.github.com/3829989#file_show_info_vis.coffee
Of course there are more sophisticated ways to do this (using template libraries, etc), but this is one way that should get the job done.
You can then use css to position / style the div as you need.
Hope this gets you going on your custom div.
Thanks
Jim
Hi there!
This is truly wonderful! Pardon me if you have covered this elsewhere, but I have a quick question that I haven’t seen directly covered elsewhere.
Background:
I want to create a visualization of my posts on a wordpress.org blog. It is a private journal-like blog that I am using to store my thoughts and what not. I have my posts categorized as quotes, poems, personal thoughts, etc. but they are all tagged with potentially similar tags.
I was thinking it would be cool to create a visualization similar to what you produced above, but with the following principles:
a) Quotes are circles, Poems are triangles, my own posts are squares
b) Links are made by commonly shared tags
c) Title and author would be used similarly to the way you used them above.
Content of the post itself could be displayed
1) under the author on the rollover text and
2) on the side for the center node — this second part a bonus, not necessarily essential
Finally, the last thing to implement would be to have a given force-directed network, but switch the center node, maybe by double-clicking?
As it pertains to the data, WordPress uses a MySql database, but it can also export as XML or as a CSV file that contains all the posts.
I have coded to a reasonable degree in each of Java, C, C++, Python, R, and Matlab, but haven’t done any web applications or databases. I am very excited to use this to learn a bit about data visualization. I am on a mac.
Question(s):
I would appreciate advice on getting started.
My biggest concern is getting the data into your program. Any advice on turning the WordPress data into a nodes and edges between all nodes of the same tags?
Also, I would love to hear other advice on any and all other aspects of the plan I listed above, including suggested (free) text editors, etc.
Thanks!
Sam
Hi Sam!
Sounds like a great project. It could reveal some insights into related posts/poems, like a mind map of your site. I think it would take a bit of work to utilize this code to create what you are talking about, but it could provide a good starting point.
I don’ t have a lot of experience extracting data from wordpress sites, but the first thing I thought of when you mentioned wanting to extract the data was converter scripts that move posts from one platform to another. Specifically, Jekyll, the blogging platform I use, has a ruby script that pulls out data from a wordpress site to organize and insert into plain text files:
https://github.com/mojombo/jekyll/blob/master/lib/jekyll/migrators/wordpress.rb
This script also appears to have rudimentary support for tags and categories:
https://github.com/mojombo/jekyll/blob/master/lib/jekyll/migrators/wordpress.rb#L159
It might be a bit more difficult attempting to use a ruby script if you are more familiar with python, but this at least gives you some of the database queries that could be used to extract tags, titles, etc.
I don’t think it would be too much of a stretch to use this script and tweak it so that in the end it builds up a data structure that can be saved off for your nodes and edges.
You would want to encode the type of the node (poem,quote,post) into each node element. Then you could look at the type when creating nodes, so you could create the right shape.
For text editors, I have switched over to using MacVim almost extensively: http://code.google.com/p/macvim/
But, I also enjoy TextWrangler, and I really enjoyed TextMate when it was in its prime.
For other software you might find useful, check out my post:
http://vallandingham.me/new_mac_setup.html
hope this helps, and let us know if you create this interesting interaction!
Also, you might check out this new d3.js based project: colony:
http://hughsk.github.com/colony/
it looks like they have a click to focus feature similar to what you want to do for your nodes.
Thanks again! Great stuff and I will continue to be checking out this incredible site in the future!
Best,
Sam
Why don’t you just set the nodes to fixed and then just initialize their positions? That way you won’t have to intercept the forcetick function to iterate over all the nodes on each tick.
Hi Wayne.
I guess that would be an option.
Part of what I enjoy about force-directed layouts is the ‘organic’ nature of the layout and how it shifts over time.
Initialization of fixed nodes would have some drawbacks, if I’m understanding what you are saying:
* You would have to pre-calculate all the node’s locations somehow and store that in the data, instead of letting the layout do that for you
* If you wanted to add dragging to the nodes, you would not have any re-positioning capabilities.
* Transitioning from one layout to another would require storing multiple locations per node?
One example of pre-calculation in a force-directed layout that I’ve seen is here:
http://dataist.wordpress.com/2012/03/11/combining-d3-and-raphael-to-make-a-network-graph/
I think this is an interesting approach that solves some speed/compatibility issues at the cost of flexibility.
Thanks for the quick reply. Yes, it does involve pre-computing all the node locations but it looks like that’s what you do anyway for your radial placement since you store all the locations in your “groupCenters” object.?
Nodes with the “fixed” property set to true can still be moved by dragging I’m pretty sure, but you may have to alter the dragging behavior.
But anyway, thanks for the guide.
Hi Jim,
This is an awesome tutorial, and thank you so much for putting it up. I just seem to have a problem right now with adding an additional JSON file that I created to view a different network. The format of the JSON file is identical to those that currently exist (i.e., uses “id”, “name”, etc.), yet when I try and view the program the network does not get generated. The only changes I made to the source code were to add my new JSON file to the data directory, and then I changed the last line of the coffee code so that it would read from the data file that I added instead of the “Call Me Al” file. Any pointers?
Thanks a million, I’ve been pulling my hair out trying to get this working.
-DM
Does it work when you use the “call me al file”?
It does indeed.
Okay, I got it working. My “match” value was screwing it up. Thanks again for the tutorial though!
Hi Jim,
Great tutorial. I’ve been using your demo as a template to map genetic and physical interactions between yeast genes and have come quite a long way. I am having one issue though. One your features I have modified is the filter function. I changed it to allow filtering based on node degree (i.e. node “weight” in D3 terms). This works great when in the default force layout, however when I switch to radial layout (in both my implementation and your demo) all of the nodes have their weight value converted to 0. This, of course, renders filtering by degree impossible when in radial view. When you switch back to the force layout the weights are restored.
I imagine this is because the nodes are somehow disconnected from their edges (i.e. links) when in radial mod.e Unfortunately, I cannot figure out how to solve this issue. Any ideas?
Thanks,
John
Fixed by changing the radial tick function as follows:
// tick function for radial layout
radialTick = function(e) {
node.each(moveToRadialLayout(e.alpha));
node.attr(“cx”, function(d) { return d.x; })
.attr(“cy”, function(d) { return d.y; });
// once alpha is sufficiently low (i.e. node positions are stabilized and not moving rapidly)
// stop the animation and update the links
if (e.alpha < 0.03) {
force.stop();
updateLinks();
// need to manually update the weight of each node. This is usually done on force.start.
// However in this layout no links are present at this point so all weight values are zero.
link.each(function(l){
l.source.weight+=1;
l.target.weight+=1;
});
node.attr("r", function(d) { return Math.max(radius,radius+2*Math.log(d.weight)); });
return 1;
}
};
Hey Jim,
Sorry to ask what seems like a rudimentary question, but I am having trouble figuring out how to label the nodes without using the tooltip. Any suggestions as to how I could do that?
Thanks,
DM
You could try something like this:
http://bl.ocks.org/MoritzStefaner/1377729
although, I think the tooltip is a bit more elegant.
or this
http://bl.ocks.org/mbostock/1212215
Hi
I want to develop application with d3.js. I use my own function for coordiantes and also want to add a simple drag drop feature for the visualization. I am able to drag nodes but how to adjust edges when I drag nodes.
Hi Jim! Looks amazing. Have you are anyone in your community figured out how to create a custom SVG (like a specific image) to replace a single node based on it’s value (or group, or name, etc…)?
Thanks,
Alex
Maybe something like this is what you are looking for?
http://bl.ocks.org/mbostock/1062383
or this?
http://bl.ocks.org/mbostock/950642
Hi, Jim
I’m working with your work, on symfony 2, and can’t reference correctly your json files, because i don’t have only one root like your project, what have i to change?