For Axios, Will Chase, with illustrations by Brendan Lynch, provides the current status…
coronavirus
-
Coronavirus variant tracker
-
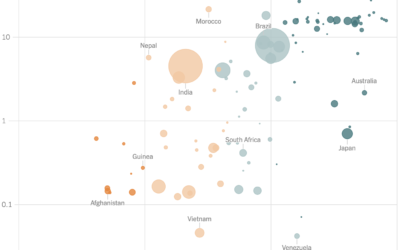
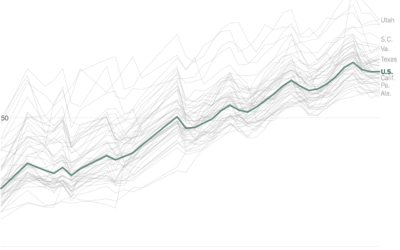
GDP and vaccination rates
For The New York Times, Keith Collins and Josh Holder look at the…
-
Rise of a variant in the U.K.
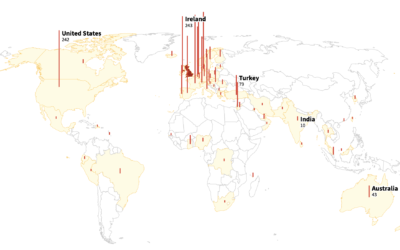
As you likely know, there are coronavirus variants around the world. Reuters mapped…
-
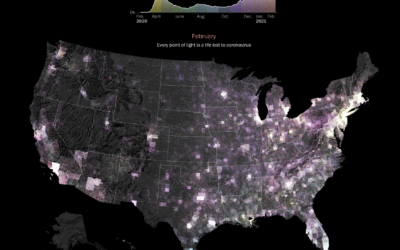
Pandemic timeline as animated dot density map
As a lead-in and backdrop to a timeline of the past year by…
-
10 statistical lessons from the past pandemic year
The Royal Statistical Society published ten lessons governments should takeaway from this year,…
-
Forecasting Covid-19 cases in the early goings
There was a lot of uncertainty in the beginning of the pandemic, so…
-
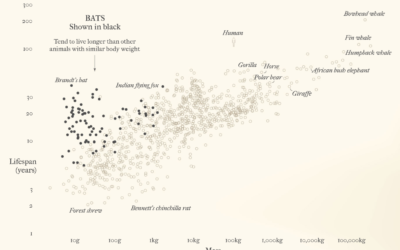
Bats and outbreaks
For Reuters, Julia Janicki and Simon Scarr, with illustrations by Catherine Tai, show…
-
Schools should open their windows for ventilation
As schools begin to reopen, The New York Times illustrates why classrooms should…
-
Social distancing when we’re back in the office
For Reuters, Sarah Slobin and Feilding Cage imagine life back at the office…
-
About that one-year decline in life expectancy
The Centers for Disease Control and Prevention released a report that said life…
-
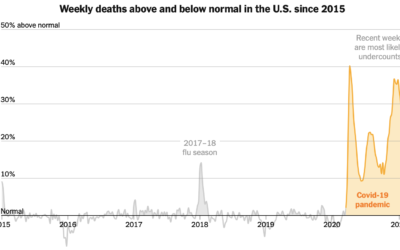
Scale of the pandemic compared to the past
While we’re on the topic of scale, The New York Times plotted weekly…
-
500,000 lives lost, an individual scale
The United States passed the half million mark for confirmed Covid-19 deaths. It’s…
-
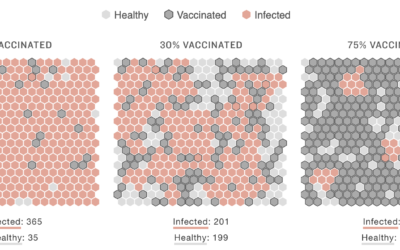
Simulation for different immunity scenarios
As vaccinations roll out, we work towards herd immunity, there are various challenges…
-
Improving vaccine distribution in all states
Lauren Leatherby and Amy Schoenfeld Walker reporting for The New York Times:
“Every… -
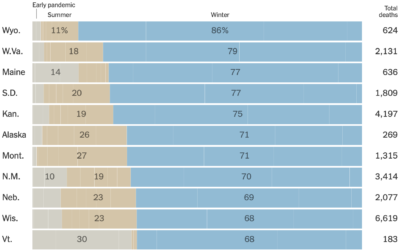
Half of coronavirus deaths were in the winter
You probably knew that coronavirus deaths have been in the several thousands per…
-
How quickly the U.S. is vaccinating vs. how long it’ll take to get back to “normal”
Vaccines provide light at the end of the tunnel, but when we finally…
-
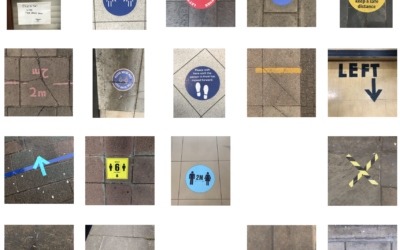
Pandemic Graphics Archive
The Pandemic Graphics Archive is a work-in-progress collection of floor signs and posters…
-
Sonification of Covid-19 deaths
This is interesting:
What does 425,000 Covid deaths sound like? I was inspired…
-
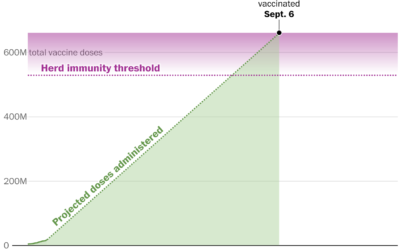
When the U.S. could be vaccinated
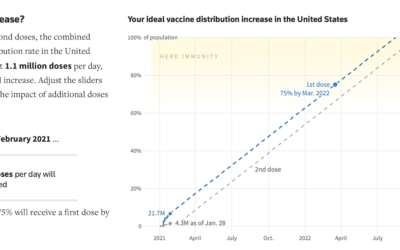
For Reuters, Feilding Cage, Chris Canipe and Prasanta Dutta made an interactive that…
-
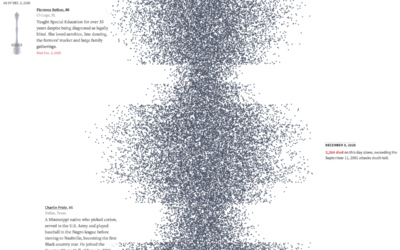
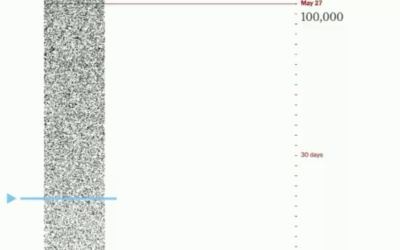
Dot density to show Covid-19 deaths over time
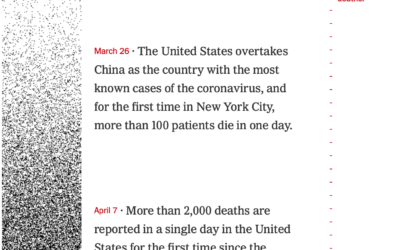
The United States passed 425,000 coronavirus deaths this week. For The New York…



 Visualize This: The FlowingData Guide to Design, Visualization, and Statistics (2nd Edition)


