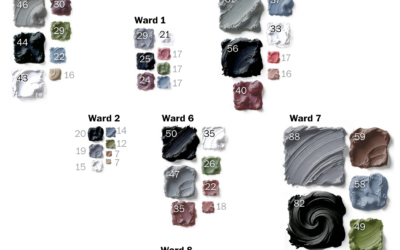
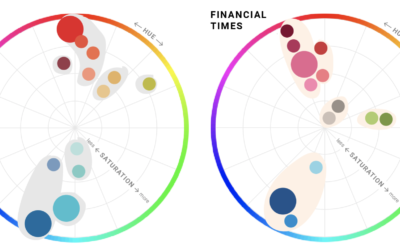
It appears that gray and neutral tones on houses are a sign of…
color
-
House colors as an indicator for gentrification
-
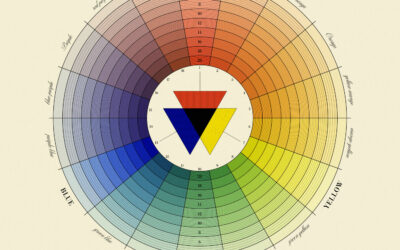
Natural System of Colours, a recreation of 18th century color wheels
In 1766, Moses Harris published The Natural System of Colours to demonstrate that…
-
Members Only
Heatmaps and Defining Color Scales
With color as the visual encoding, choose the scales that allow you to see actual patterns.
-
Color picker with R
As we have learned over the years, there can never be enough color-picking…
-
Rainbow Sky, the colors mentioned on Bluesky
Martin Wattenberg drew up a live visualization that shows colors mentioned in Bluesky…
-
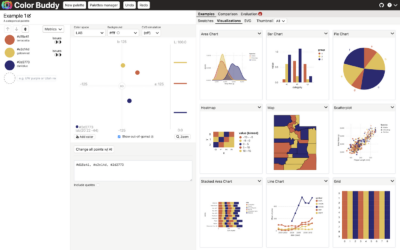
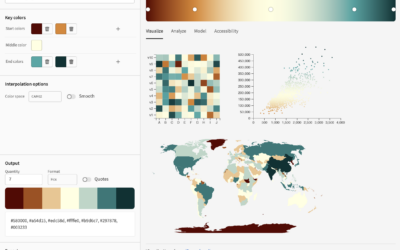
Color Buddy, a tool for building color palettes for visualization
Picking colors for visualization can be tricky, because there are infinite possibilities across…
-
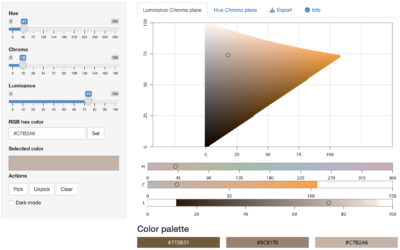
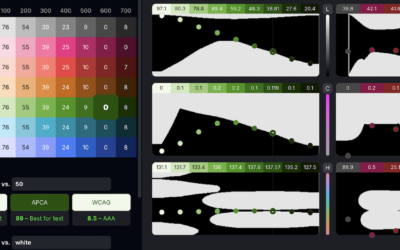
Huetone for accessible color systems
There is no shortage of color-picking tools, but it seems there can never…
-
Members Only
Re-Edit: Odd Color Choice for a Map
Choosing colors can seem like a burden when you just want to make something quick, which is why some people just use default color schemes. But the few extra minutes is worth it.
-
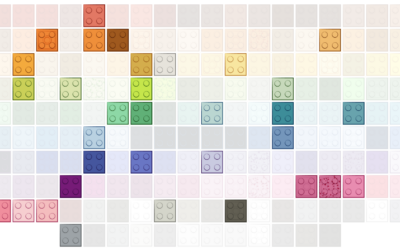
Evolution of Lego brick colors
Lego started with five brick colors: red, yellow, blue, white, and clear. The…
-
An interactive guide to color and contrast
Color and contrast choices often are a product of personal preferences, but you…
-
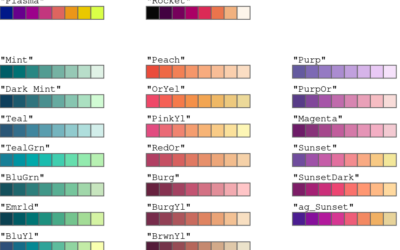
Improved color palettes in R
Achim Zeileis and Paul Murrell provide a rundown of the more user-friendly color…
-
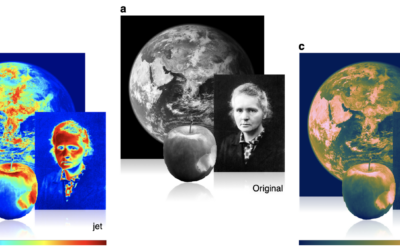
Misuse of the rainbow color scheme to visualize scientific data
Fabio Crameri, Grace Shephard, and Philip Heron in Nature discuss the drawbacks of…
-
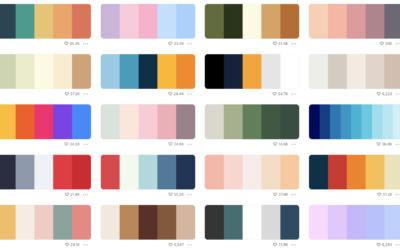
Color palette generator
In the never-ending quest to find the perfect color scheme for any given…
-
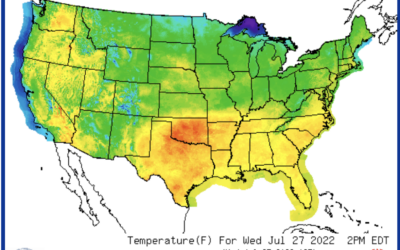
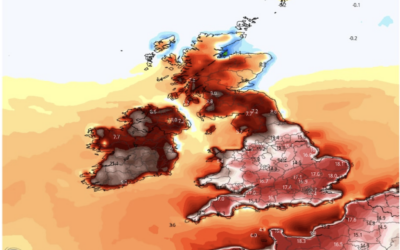
Mapping extreme heat
For Bloomberg, Marie Patino reports on the shifting design choices for mapping weather…
-
A plea to stop climate change from the guy who makes maps
For Washington Post Opinion, a struggling mapmaker makes a plea to stop climate…
-
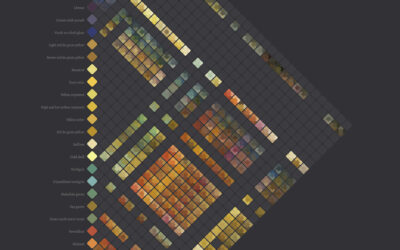
Diagram of watercolors from the 17th century
In 1692, artist A. Boogert published a guide to watercolors, showing the thousands…
-
A color tool for accessible schemes
Leonardo is an open source project from Adobe that helps you pick accessible…
-
Defining color palettes for all your charts
Selecting a color palette for a single chart can be tricky, which is…
-
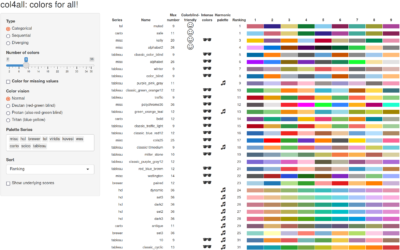
Colors for All, R package
If you use color as a visual encoding, you should make sure every…
-
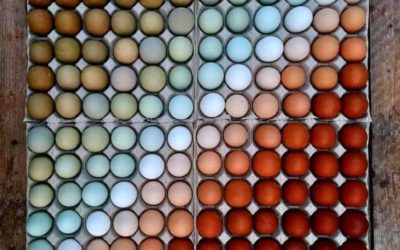
Chicken egg color spectrum
Eggs aren’t always white, which is oddly calming in this photo by way…


 Visualize This: The FlowingData Guide to Design, Visualization, and Statistics (2nd Edition)


