In the last roundup of 2021, here’s the good stuff for December.
In the last roundup of 2021, here’s the good stuff for December.
This is Hallgrímskirkja, a church in Reykjavík, Iceland. It will now also be known as the Church of the 95% Confidence Interval.
The Church of the 95% Confidence Interval #rstats pic.twitter.com/m0gvvu2Dav
— Julien Cloarec (@CloarecJulien) December 5, 2021
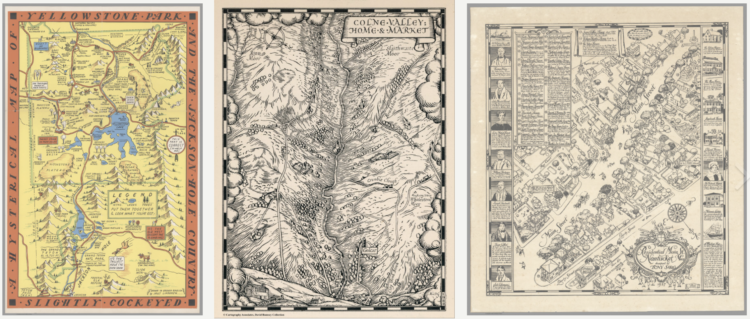
The David Rumsey Map Center at Stanford houses hundreds of thousands of maps dating back to the 1500s. Andres Picon for San Francisco Chronicle wrote about the collection:
At the heart of that endeavor is the digitization of Rumsey’s vast physical collection, a project he began in the late 1990s when he launched davidrumsey.com, a constantly growing aggregation of about 112,000 digitized historical maps from his personal inventory. Rumsey, 77, is in the process of donating his entire map collection — more than 200,000 physical maps plus the digital ones — to Stanford so that they can be cataloged for the enjoyment of generations to come.
“It’s not only a database; it allows people to get lost inside it, no pun intended,” he said. “If you make it really usable and accessible the way ours is, it just becomes something different.”
For preservation, I wish we saw more of this and less blockchain. Hundreds of years from now, how much visualization work is still viewable?
You can view a large portion of the Rumsey collection here. You can also browse the data visualization tag to see some of the earliest made charts.
Justin Sherman for Wired points out the farce that is anonymized data:
Data on hundreds of millions of Americans’ races, genders, ethnicities, religions, sexual orientations, political beliefs, internet searches, drug prescriptions, and GPS location histories (to name a few) are for sale on the open market, and there are far too many advertisers, insurance firms, predatory loan companies, US law enforcement agencies, scammers, and abusive domestic and foreign individuals (to name a few) willing to pay for it. There is virtually no regulation of the data brokerage circus.
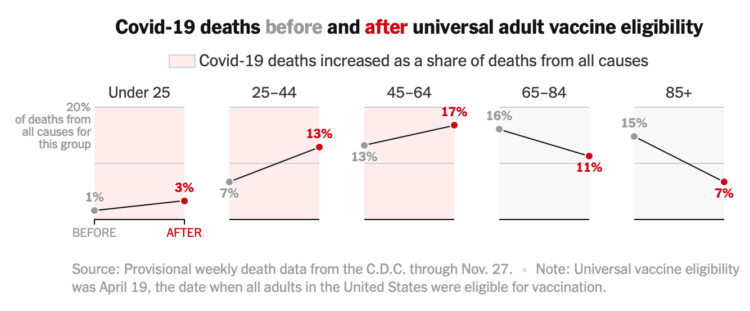
Denise Lu and Albert Sun for The New York Times show the shifts in Covid-19 deaths among different demographic groups:
The change in death rates among groups is starker by race and ethnicity, and the death rate has risen particularly sharply for middle-aged white people. Covid-19 now accounts for a much larger share of all deaths for that group than it did before vaccines were widely available.
In a series of slope charts, each multiple shows a group, and the background color indicates an increase (red) or a decrease (gray) in deaths among that group.
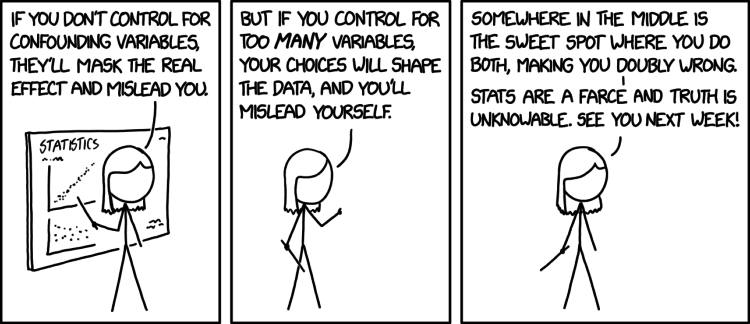
xkcd makes Statistics so fulfilling. George E. P. Box comes to mind.
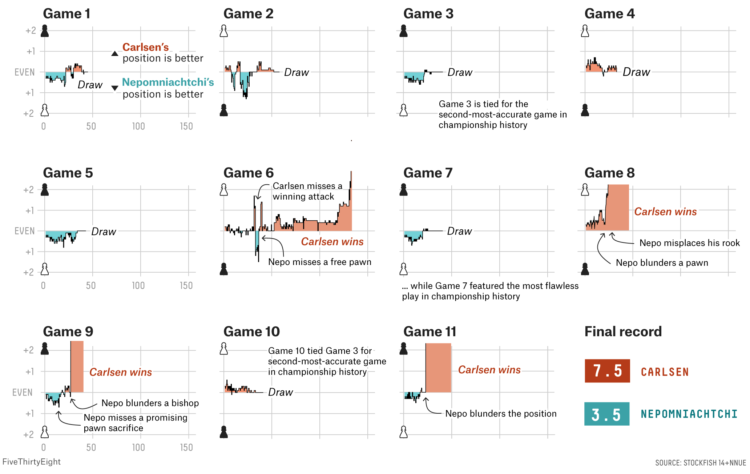
Magnus Carlsen continued to assert his dominance at the World Chess Championship. FiveThirtyEight broke down Carlsen’s dominance in the final match with Ian Nepomniachtchi with a series of difference charts. In the quick view, you see it was either a draw or a Carlsen win over 11 games.

Many colleges use virtual proctoring software in an effort to reduce cheating on tests that students take virtually at home. But the software relies on facial recognition and assumptions about the proper testing environment. YR Media breaks down the flaws and even provides a simulation so that you can see what it’s like.
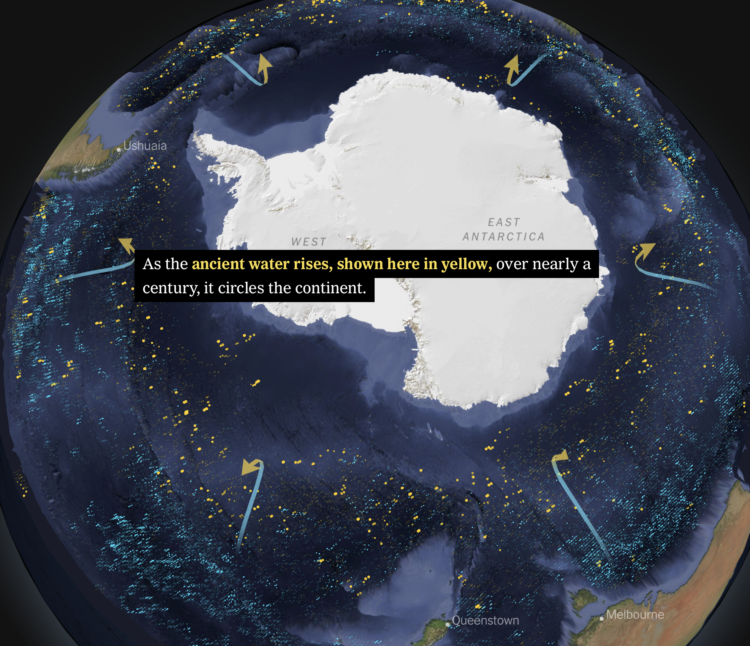
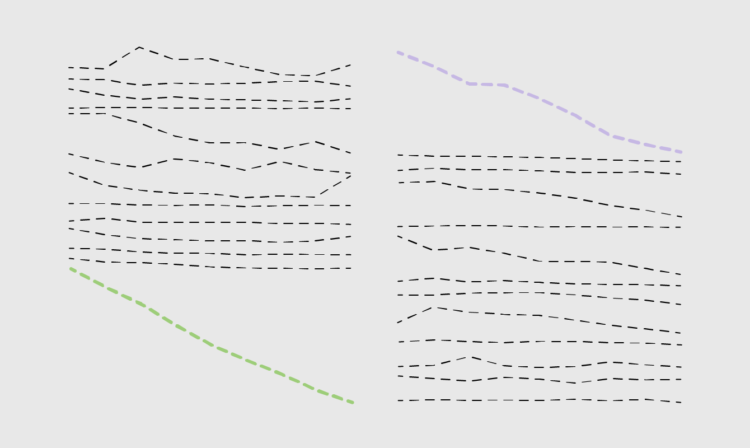
Based on data from autonomous sensors floating in the oceans, researchers are able to model the flows and characteristics of ocean currents in more detail than ever before. For The New York Times, Henry Fountain and Jeremy White show how the shifts have unwelled centuries-old water deep in the ocean, which releases carbon into the air.
The scrollytelling format of this piece works well to show sensor estimates over time. You get a sense of the currents without needing to see animated lines.
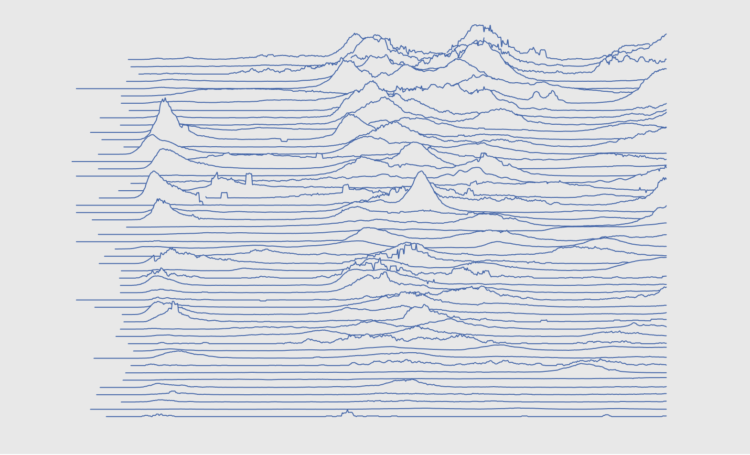
Also known as ridgelines, use the method to create a compact visualization where you can easily identify major patterns and outliers.
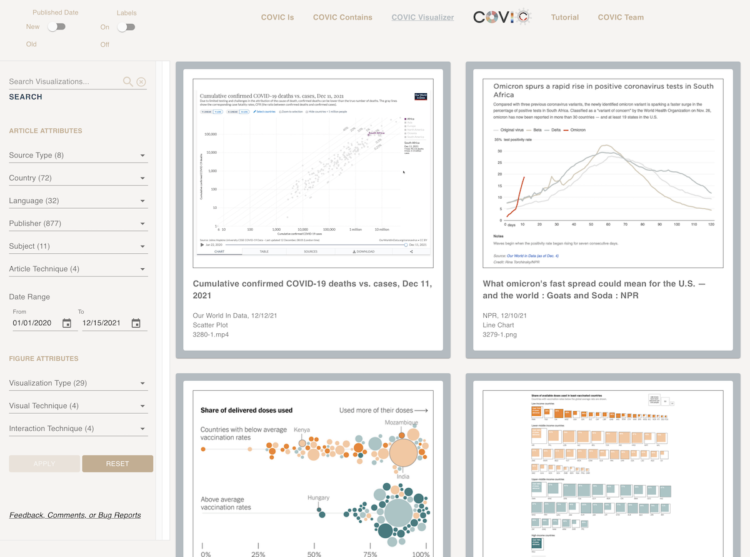
The COVID-19 Online Visualization Collection is a project to catalog Covid-related graphics across countries, sources, and styles. They call it COVIC for short, which seems like a stretch for an acronym and a confusing way to introduce a project to people. But, it does categorize over 10,000 figures, which could be useful as a reference and historical context.
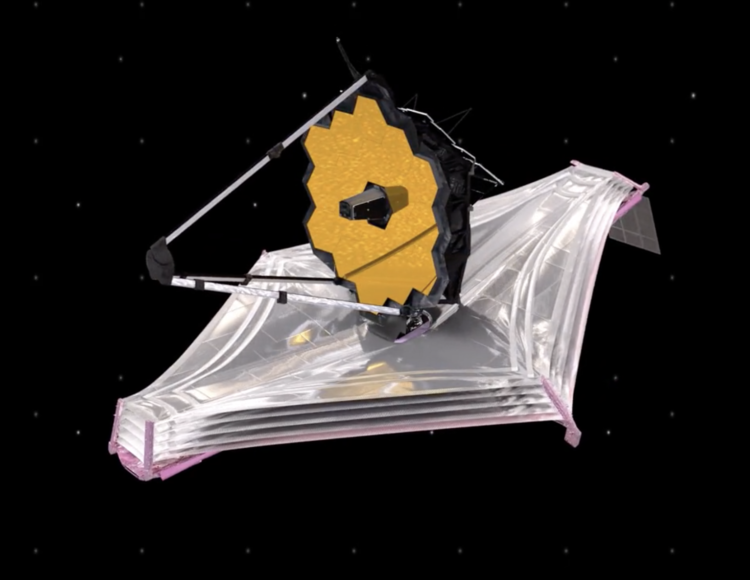
NASA is launching the James Webb Space Telescope on December 22, 2021 with an objective to collect data on light from 13.8 billion light-years away.
Using 3-D models from NASA, Rahul Mukherjee and Lorena Iñiguez Elebee for The Los Angeles Times show how the $10 billion telescope works and how NASA plans to launch the telescope into orbit a million miles from Earth. Nothing to it.
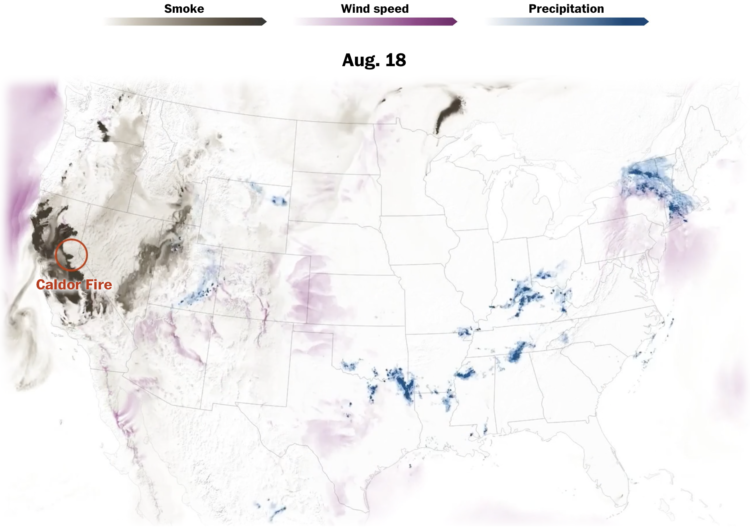
Zach Levitt and Bonnie Berkowitz for The Washington Post mapped and animated the natural and weather disasters from 2021. Differing from the 2019 version by Tim Meko, they framed it by month, which let them start with floods in January, through the storms in March, April, and May, to fires in July, up to the tornadoes in December.
It was a rough year for many, only compounded by that virus.
Steven L. Franconeri, Lace M. Padilla, Priti Shah, Jeffrey M. Zacks, and Jessica Hullman published in Psychological Science in the Public Interest an expansive review of what researchers know so far about how visualization works:
Effectively designed data visualizations allow viewers to use their powerful visual systems to understand patterns in data across science, education, health, and public policy. But ineffectively designed visualizations can cause confusion, misunderstanding, or even distrust—especially among viewers with low graphical literacy. We review research-backed guidelines for creating effective and intuitive visualizations oriented toward communicating data to students, coworkers, and the general public. We describe how the visual system can quickly extract broad statistics from a display, whereas poorly designed displays can lead to misperceptions and illusions. Extracting global statistics is fast, but comparing between subsets of values is slow. Effective graphics avoid taxing working memory, guide attention, and respect familiar conventions. Data visualizations can play a critical role in teaching and communication, provided that designers tailor those visualizations to their audience.
The paper is free to access.
I’m bookmarking this for later. It’s going to take a while to digest.
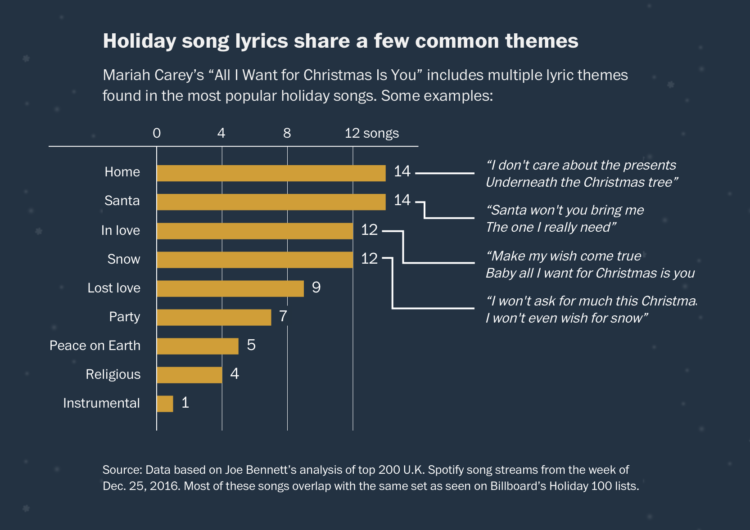
You know it’s the holiday season when Mariah Carey starts singing about wanting you for Christmas. The Washington Post goes into why we listen to the same songs every year:
Holiday music burrows into a sweet spot in our brains’ wiring, said Brian Rabinovitz, a lecturer at the College of William & Mary whose expertise is the neuroscience of music.
All music can stimulate the brain’s pleasure centers, he said, but holiday music can evoke treasured memories on top of that, courtesy of the brain’s filing system. Tonal patterns and autobiographical events are processed in overlapping regions of the medial prefrontal cortex.
Kind of the same reasons why we watch re-runs.
See also Jon Keegan’s analysis of old Christmas songs.
A little bit of sorting and organization can make a big difference in readability.
[arve url=”https://www.youtube.com/watch?v=LkaLfbuB_6E” /]
NASA launched the Parker Solar Probe in 2018 in an effort to explore closer to the sun. The probe recently flew through and out of the Sun’s upper atmosphere to successfully sample particles and magnetic fields. Amazing.
The video above from NASA explains the origins, challenges, and future of the project. I want all government agencies to release videos like this.
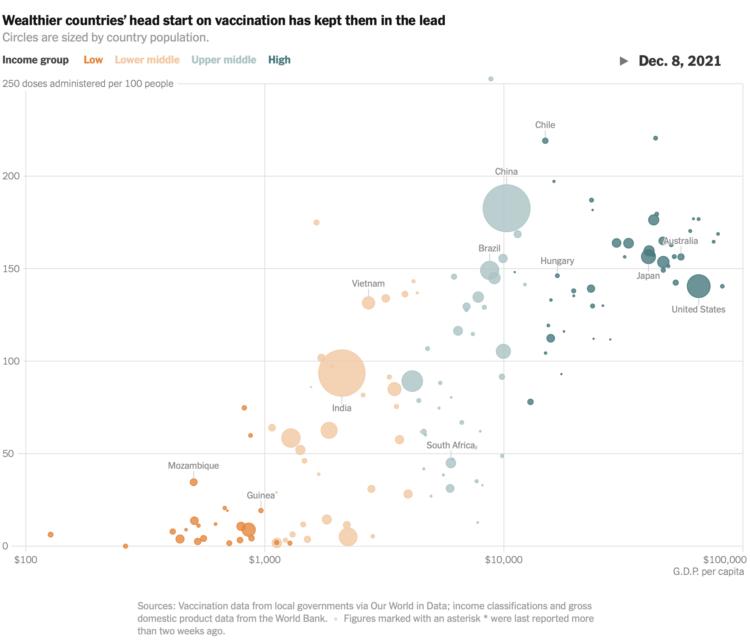
Vaccine supply is only part of the equation. For The New York Times, Keith Collins and Josh Holder looked at distribution of available doses in countries, categorized by income group.
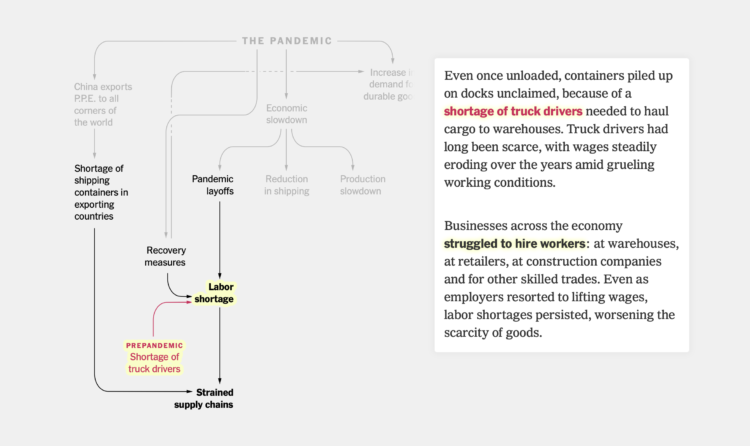
Lazaro Gamio and Peter S. Goodman for The New York Times used a flowchart to explain how the world’s supply chains got to where they are now. The scroll takes you through the set of intertwining variables.
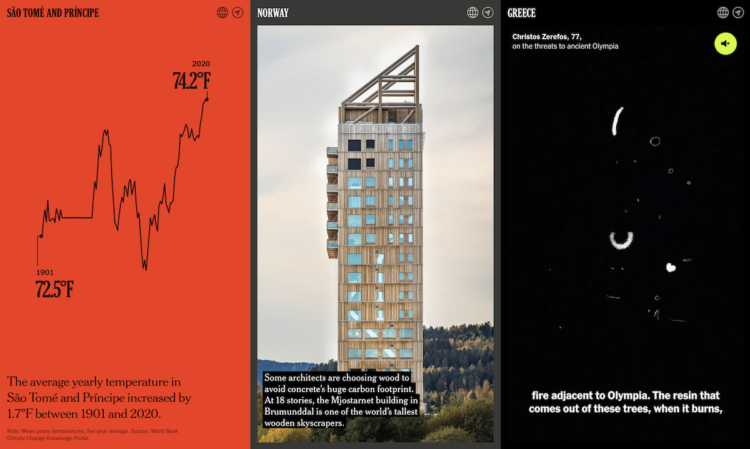
The effects of climate change can be seen around the world, in the present. The New York Times uses a mix of maps, charts, videos, illustrations, and photographs to imagine postcards sent from every country in the world to show what’s happening.


 Visualize This: The FlowingData Guide to Design, Visualization, and Statistics
Available now.