Andrew Vande Moere writes in his 2005 paper Form Follows Data:
[W]e can perceive a current trend in portable input and output devices that trace, store and make users aware of a rich set of informational sources. So-called ubiquitous computing is moving into the direction of location-based information awareness, enabling users to both access and author dynamic datasets based upon a geographical context through electronic communication media.
With this growing trend of streaming data in mind, Andrew goes on to say
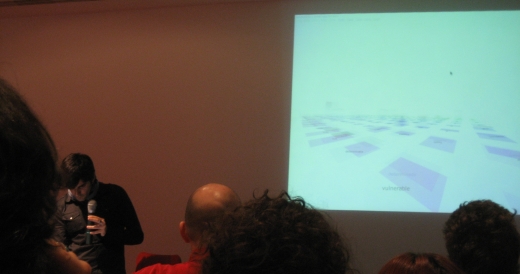
Building automation services enable spaces to react to dynamic, physical conditions or external data sources in real time. Currently, these interactions are programmed by engineers, and imply simple action-reaction rules, such as the control of lights, security or climate control: what would be possible if these tools are offered to designers, concerned with the emotional experience of people?
If you’re an engineer, you might be wondering, “Hey! Why can’t I design ambient systems? I care about emotional experience too. Somewhat. Sort of.” As someone who majored in electrical engineering and computer science and still works with a lot of engineer types, I will tell you why. Engineers are generally not very good at the visual display of data. To engineers, the most beautiful part of a data visualization installation might be the hardware, elegant code, or the hours spent tweaking the system’s logic. Engineers are fascinated with the guts of the system.
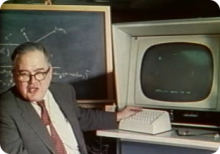 With the start of a new year, it only seems right to open with John Tukey and his work with interactive graphics. In 1972, when computers were giant and screens were green, John Tukey came up with PRIM-9, the first program to use interactive dynamic graphics to explore multivariate data. PRIM-9 allowed picturing, rotation, isolation, and masking. In other words, PRIM-9 allowed users to see multivariate data from different angles and identify structures in a dataset that might otherwise have gone undiscovered (kind of like the more recent
  Merry Christmas Bedford Falls! Merry Christmas you old Savings and Loan! Merry Christmas Mr. Potter! Merry Christmas! Gosh, I love that movie. I watch it every year, and it never gets old. That scene where he comes home so happy to be alive, his children are hanging off of him, and he’s embracing his wife… wonderful.
 Time Magazine’s multimedia section has a fun, little piece showing some statistics for a day in the
  For our
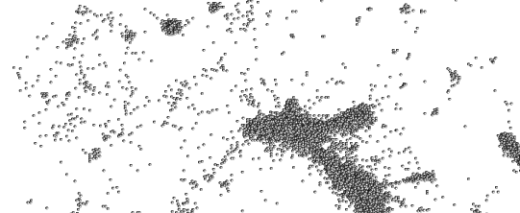

 Visualize This: The FlowingData Guide to Design, Visualization, and Statistics (2nd Edition)


