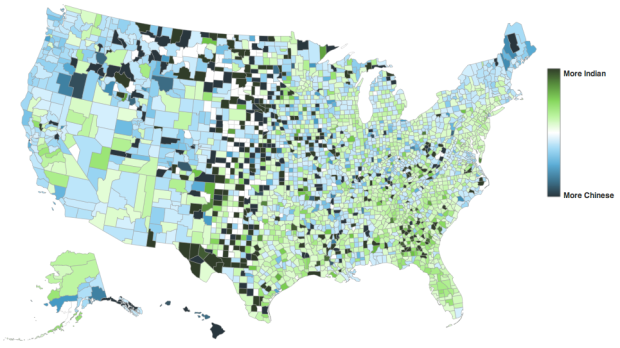
At first I thought this map, by David Yanofsky for Bloomberg, was your standard county-level choropleth map of demographics. Select a self-described heritage from the first drop down and you see where all the people are by count. That’s only kind of interesting, but you often just end up highlighting big cities.
However, select a heritage from the second drop down menu to compare against the first and you get a relative scale. The above for example shows those of Chinese and Indian heritage. It’s a simple calculation that makes a big difference in usefulness.


 As a complement to Shan Carter’s
  Visualize This: The FlowingData Guide to Design, Visualization, and Statistics (2nd Edition)


