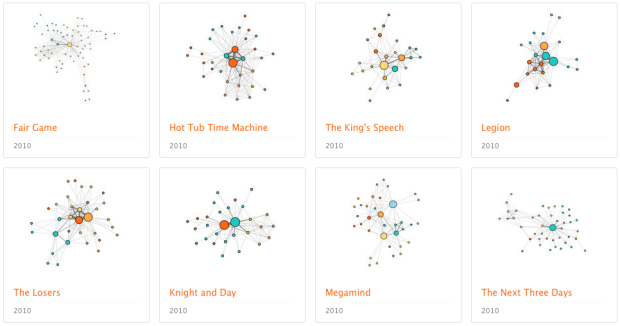
We’ve seen a lot of network charts for Twitter, Facebook, and real people. Screw that. I want to see social networks for movie characters. That’s where Movie Galaxies comes in.
Movies are important artefacts, bringing together vision and zeitgeist of our society. Embodying dreams, trends and other perspectives, they are a cultural vanishing point for millions of people in the world, that is worth to be explored. Just think about how your personal life and worldwide network with their single sub-clusters and side-stories are structurally represented in motion pictures. You might be surprised. We have a hunch that the “holy grail” of good movies is far more about social network structures than budget, cast and theme.
With movie scripts as the data source, Movie Galaxies quickly shows main characters, the extent to which they interact, and hints at a movie’s timeline. For example, in the first Lord of the Rings movie, the central plot was tied to a lot of characters, whereas in Forrest Gump, everything was tied to one character.
There are metrics, such as density and clustering, associated with each network, which could be made less technical sounding, but it’s fun to browse and search your favorite movies. I clicked around for a good half hour.


 Visualize This: The FlowingData Guide to Design, Visualization, and Statistics (2nd Edition)


