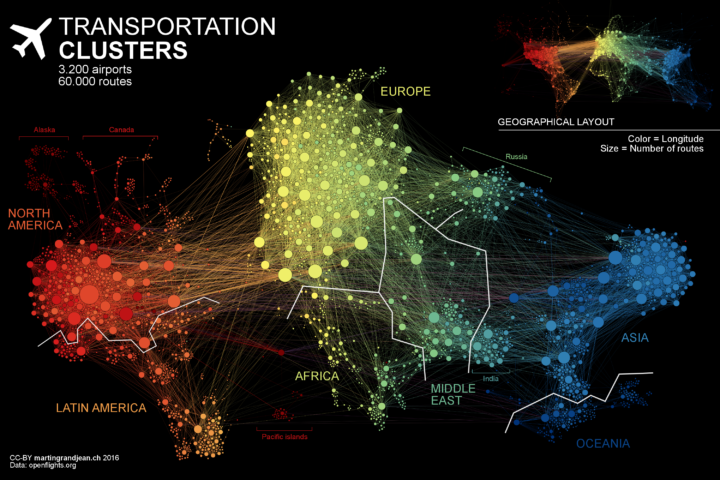
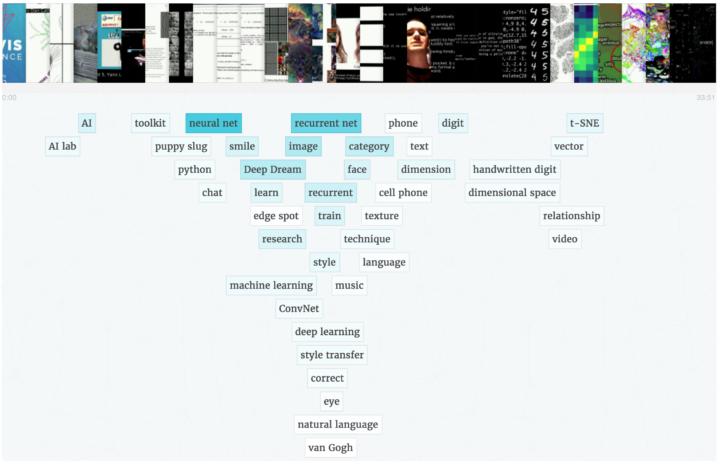
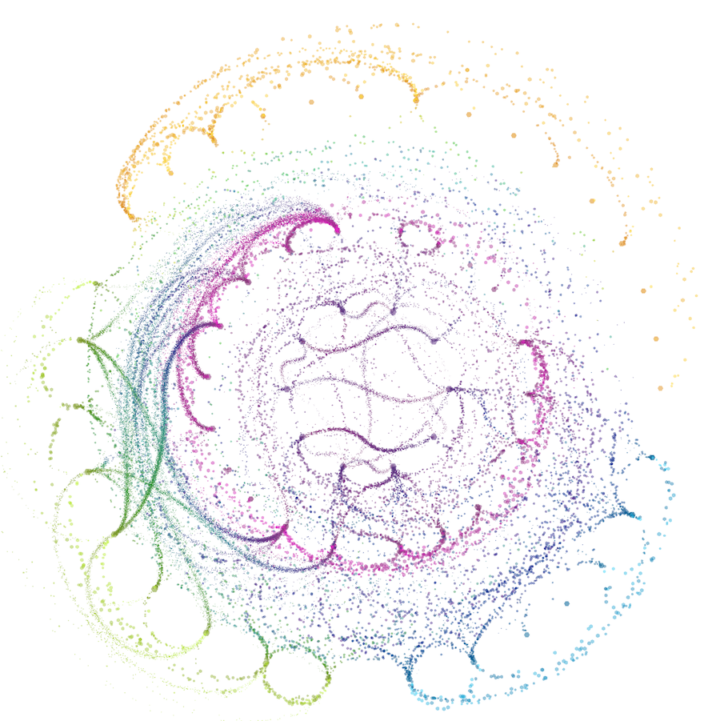
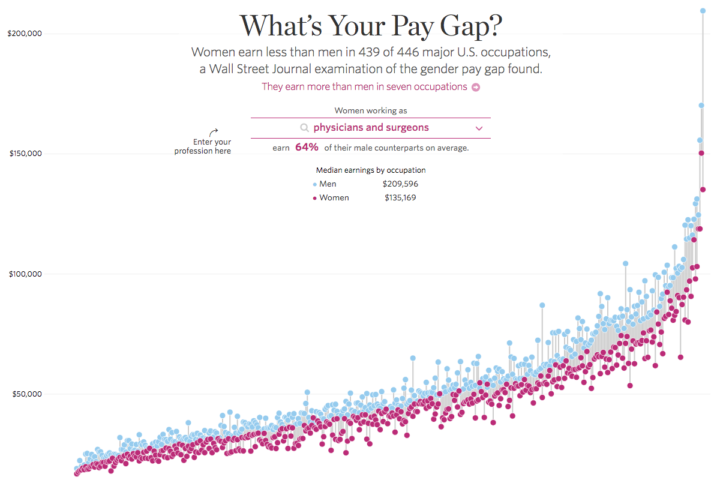
Wealth inequality is a real thing that is complex and a result of various factors. It’s difficult to capture everything in one chart, so Urban Institute explained wealth inequality in nine charts instead.
Read More
-
-
-
The Cartography and Geovisualization Group at Oregon State University and NASA visualized a one-year life cycle of carbon dioxide in an interactive video map.
Read More -
Oliver Roeder for FiveThirtyEight covered this year’s American Crossword Puzzle Tournament and the battle between Tyler Hinman and Dan Feyer.
Read More -
There were a couple of similar quantified self articles last week about email. They’re both joke-ish but kind of interesting with a this-is-kind-of-pointless undercurrent. In one, Paul Ford analyzes his email archive and deems it a failure after he finds nothing interesting. In the second, Emma Pierson analyzes her email in the context of a long-distance relationship.
Read More -
The “speed of light” typically means “really fast” but when it’s relative to the scale of the universe, maybe not so much. Animator Alphonse Swinehart shows what it might look like to follow a photon from the sun to Jupiter, where the speed of light can sometimes feel really slow.
Watch the video -
Using calculations by Nick Kasprak from the Center on Budget and Policy Priorities and Kyle Pomerleau from Tax Foundation, Amanda Cox shows tax penalties and bonuses for married couples.
Read More -
Members Only
It’s easy to draw dots. The challenge is to make them meaningful and readable.
-
In their continued efforts to present statistics as a field that doesn’t suck, the American Statistical Association provides this pitch video. I approve of this message.
Watch the video -
LEGOs make everything better. David Wessel for Brookings Institution explains how federal taxes play a role in decreasing the income gap. Each column an income quintile and each brick a lump of money.
Watch the video -
In English, there’s an idiom that notes confusion: “It’s all Greek to me.” Other languages have similar sayings, but they don’t use Greek as their point of confusion.
-
We know there are a lot of deaths in Game of Thrones, but how does this relate to real life? As fans eagerly wait for the next book in the series by George R. R. Martin, many won’t live long enough to see it published. Statistics PhD student Jerzy Wieczorek dives into reader demographics and actuarial tables to estimate how many people died before the show even aired.
Read More -
Asterank is an asteroid database maintained by Ian Webster, an engineer at Google. It contains information for over 600,000 asteroids.
Read More -
Mt. Everest is a tall mountain. How tall is it?? Glad you asked. The Washington Post has a tall scrolling graphic to help you understand the scale of the world’s tallest mountain. But, instead of scrolling down the page, the scroller takes you to the bottom of the mountain first and against all preconceived notions of scrolling on the internet, you scroll up. Gasp.
-
-
Martin Bellander saw some projects that extracted color from movie posters and trailers, and he grew curious about paintings. So he extracted and plotted the colors used in paintings over several centuries.
Read More -
Remember that engineer’s guide to drinks a while back? I think this one pre-dates it. But, the best part is that you can download it from the National Archives Catalog, and for some reason the creator is listed as the Forest Service from the Department of Agriculture. Made in 1974. [via kottke]
-
Did you watch the latest Last Week Tonight with John Oliver yet? You should. It’s on government surveillance, presented in a way that’s relevant and entertaining for all.
Watch video -
Matthew Bloch and Haeyoun Park for the New York Times mapped, for about 400 water districts, how much water Californians use per capita on a daily basis. In some areas, the daily average is over 500 gallons per capita. That’s nuts.
Read More