Never Been Married
Through the eyes of data from the American Community Survey, we looked at when in life people tend to get married. As you might expect, the trends vary quite a bit by demographic, but most people marry at least once at some point.
Not everyone though.
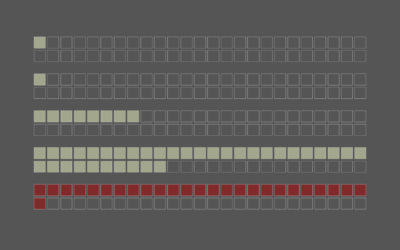
Some people never get married, and some wait longer than others. Let’s look at these people. Using the same data from the 2014 ACS, extracted from the Integrated Public Use Microdata Series, we can see what percentage of people never married, given their age and demographic.
The chart starts at zero years of age and goes to 85 and older. The percentages of course start at 100 since most people aren’t married right at birth. There’s a slow drop in the teenage years, and then the values drop fast in the twenties.
Things start to level off around 40 years, more so for some demographic groups. For example, only 16 percent of white females at 40 years did not marry yet. In contrast, about 43 percent of black females of the same age had not married.
For just about every group listed, the distributions shift younger from male to female. However, you don’t get that shift for blacks, which is kind of interesting (related?).
 Marrying Age
On the other hand, here’s when people get married.
Nerd Notes
- A caveat: You would expect the curve for each group to be smooth all the way down, from left to right, if it was a full representation of the population. But you’ll notice fluctuations as you look at older ages. This was a limitation in the dataset. You can only get the year of the most recent marriage from the ACS, which means you can calculate age for people who married multiple times. So instead, at each year, I could only look at percentage of people at that actual age who never married.
- There are no values for some groups in the early years, because for things like employment the age is not applicable. You can’t legally work until you’re of a certain age.
Chart Type Used

Become a member. Support an independent site. Get extra visualization goodness.
See What You Get