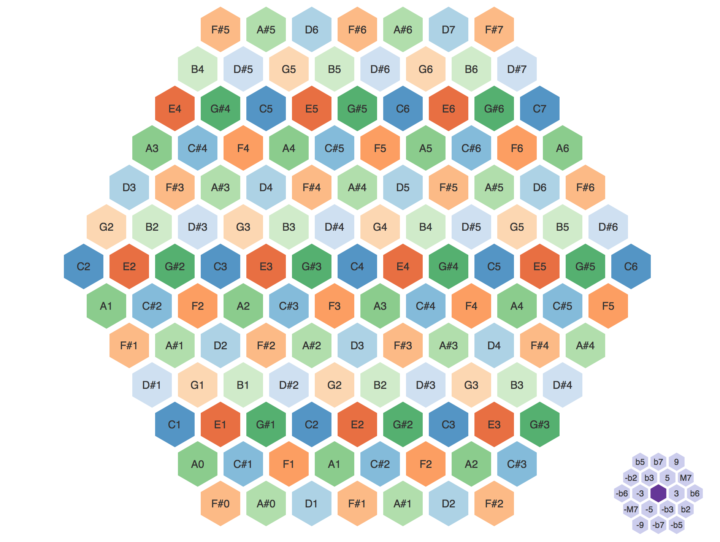
This is a fun ditty by Vasco Asturiano. I’m a little too far out from my eighth grade jazz band days, but it’s still fun to mess around with. Notes can be arranged in different ways, and then you just mouse over the hexagons to play.
This is a fun ditty by Vasco Asturiano. I’m a little too far out from my eighth grade jazz band days, but it’s still fun to mess around with. Notes can be arranged in different ways, and then you just mouse over the hexagons to play.
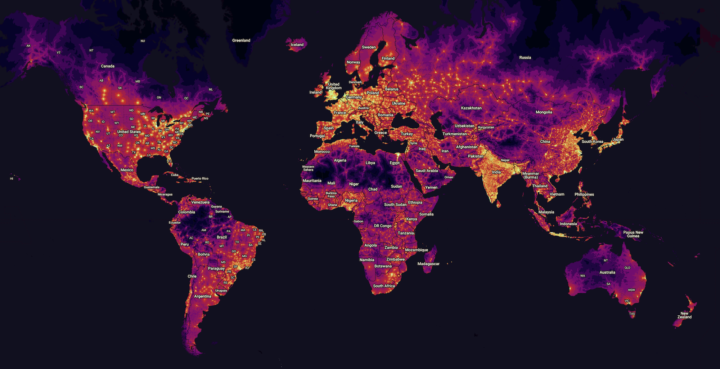
From The Malaria Atlas Project, a global map of estimated accessibility to cities:
In the present study, we quantify and validate global accessibility to high-density urban centres at a resolution of 1×1 kilometre for 2015, as measured by travel time. The last global mapping effort to measure accessibility was for the year 2000, a time that predates both substantial investment and expansion of transportation infrastructure and an extraordinary improvement in the data quantity and quality of accessibility measures. The game-changing improvement underpinning this work is the first-ever, global-scale synthesis of two leading roads datasets – Open Street Map (OSM) data and distance-to-roads data derived from the Google roads database – which resulted in a nearly five-fold increase in the mapped road area relative to that used to produce the circa 2000 map.
The dark areas are the most fascinating.
Dan Hurley, reporting for The New York Times, describes the use of statistical software to assist call screeners:
[T]he decision to screen out or in was not Byrne’s alone. In August 2016, Allegheny County became the first jurisdiction in the United States, or anywhere else, to let a predictive-analytics algorithm — the same kind of sophisticated pattern analysis used in credit reports, the automated buying and selling of stocks and the hiring, firing and fielding of baseball players on World Series-winning teams — offer up a second opinion on every incoming call, in hopes of doing a better job of identifying the families most in need of intervention. And so Byrne’s final step in assessing the call was to click on the icon of the Allegheny Family Screening Tool.
I’m glad Hurley highlights the challenges of the inherent biases in the data and the algorithms later in the article. It’s one thing to use data to estimate player value in sports. It’s another thing to use data to decide whether or not to send help to someone calling the police. [Thanks, Jennifer]
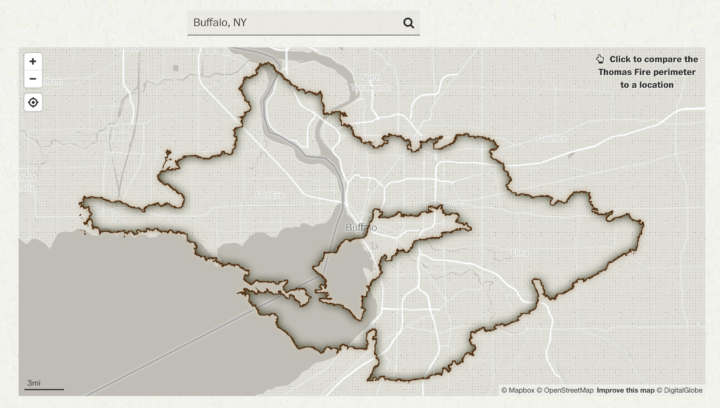
The past few days in California has been non-stop rain, but the months before that, there was unprecedented wildfires in the state. Lauren Tierney, reporting for The Washington Post, provides an overview along with a scale comparison of 2017’s biggest fire against anywhere on the globe.
FiveThirtyEight used a dataset on broadband as the basis for a couple of stories. The data appears to be flawed, which makes for a flawed analysis. From their post mortem:
We should have been more careful in how we used the data to help guide where to report out our stories on inadequate internet, and we were reminded of an important lesson: that just because a data set comes from reputable institutions doesn’t necessarily mean it’s reliable.
Then, from Andrew Gelman and Michael Maltz, there was the closer look at data collected by the Murder Accountability Project, which has its merits but also some holes:
if you’re automatically sifting through data, you have to be concerned with data quality, with the relation between the numbers in your computer and the underlying reality they are supposed to represent. In this case, we’re concerned, given that we did not trawl through the visualizations looking for mistakes; rather, we found a problem in the very first place we looked.
There’s also the ChestXray14 dataset, which is a large set of x-rays used to train medical artificial intelligence systems. Radiologist Luke Oakden-Rayner looked closer, and the dataset appears to have its issues as well:
In my opinion, this paper should have spent more time explaining the dataset. Particularly given the fact that many of the data users will be computer scientists without the clinical knowledge to discover any pitfalls. Instead, the paper describes text mining and computer vision tasks. There is one paragraph (in eight pages), and one table, about the accuracy of their labeling.
For data analysis to be meaningful, for it to actually work, you need that first part to be legit. The data. If the data collection process rates poorly, missing data outnumbers observations, or computer-generated estimates aren’t vetted by a person, then there’s a good chance anything you do afterwards produces questionable results.
Obviously this isn’t to say avoid data altogether. Every abstraction of real life comes with its pros and cons. Just don’t assume too much about a dataset before you examine it.

The usually abstract, qualitative and sometimes quantitative chart type shows relationships. You can make them in R, if you must.
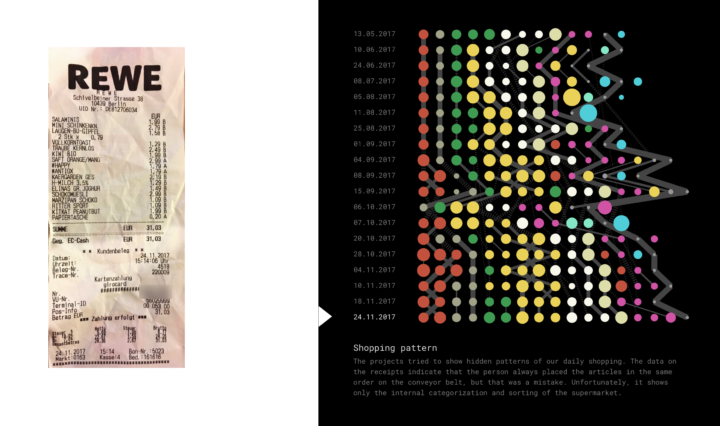
Good lesson here. Christian Laesser was playing around with receipt data and initially thought he had a fun pattern at hand. It looked like the shopper always put things in his or her cart in the same order every time. It turns out though that the order just came from the computer ordering items by category. It had nothing to do with shopping order.
Familiarize yourself with your data source before you go deep diving for insights.
Alan Blinder and Michael Wines reporting for The New York Times:
A panel of federal judges struck down North Carolina’s congressional map on Tuesday, condemning it as unconstitutional because Republicans had drawn the map seeking a political advantage.
The ruling was the first time that a federal court had blocked a congressional map because of a partisan gerrymander, and it instantly endangered Republican seats in the coming elections.
Go math.
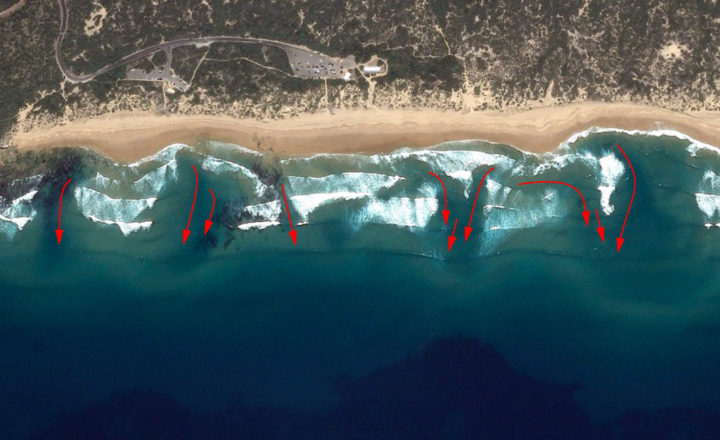
Rip currents are like hidden rivers near the shore that head out to sea. An unexperienced swimmer or surfer can get caught in one, panic, and drown. So The Sydney Morning Herald put together a guide on how to spot rips. The mix of video and graphics makes things more clear, as they better represent what people will actually see at the beach. And the overheads for many major beaches in Australia are also helpful. [Thanks, Neville]

Data is an abstraction, and it’s impossible to encapsulate everything it represents in real life. So there is uncertainty. Here are ways to visualize the uncertainty.
The Obliteration Room (2012) by artist Yayoi Kusama started as a blank white room and ended as a room completely covered by dotted stickers.
It’s like the early stages of a Reddit April Fool’s joke.
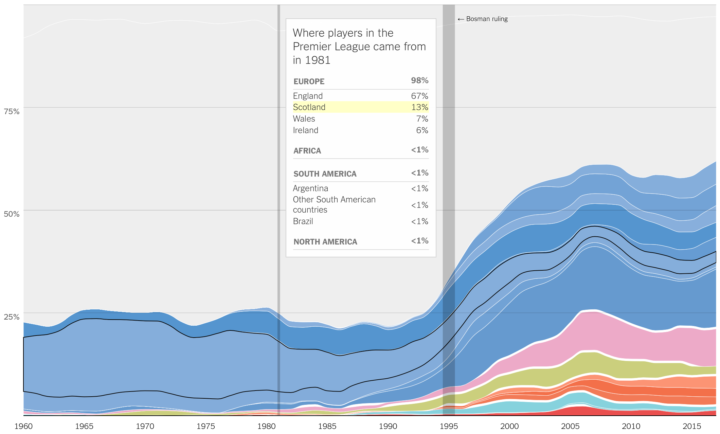
Sports are growing more international with respect to the athletes. Gregor Aisch, Kevin Quealy, and Rory Smith for The Upshot show by how much, with a focus on leagues in Europe and North America.
I like how: The dominant home country in each chart doubles as background and a layer; the tooltip shades the country you moused over while still showing the other countries; and the missing data and gaps are shown clearly but don’t obstruct the overall view.
If you’re looking to acquaint yourself with R — the non-coding aspects of the language — the brief Field Guide to the R Ecosystem by Mark Sellers might help.
Perhaps, you’re a hobbyist R user, who’d like to provide more information to your company in order to make a case for adopting R? Maybe you’re part of a support team who’ll be building out infrastructure to support R in your business, but don’t know the first thing about R. You might be a manager or executive keen to support the development of an advanced analytics capability within your organisation. In all of these cases, the field guide should be useful to you.
Useful.
If you want to learn coding with R though, get into tutorials and examples, and you pick up the stuff in this guide in the process of learning.
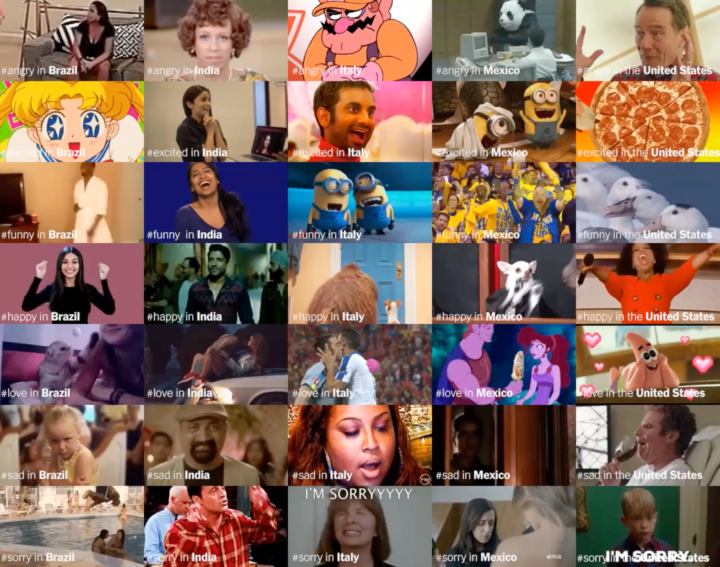
People often use animated GIFs to digitally express caricatures of emotion or reaction. So when you look at the most distinct ones of various countries associated with specific emotions, you get sort of a caricature for each region. Amanda Hess and Quoctrung Bui for The Upshot looked.
I wonder what the GIFs look like for people who are less likely to display emotion. Does the straight face cross over to GIF usage, or is there a dichotomy of real-life and digital self? I must know.
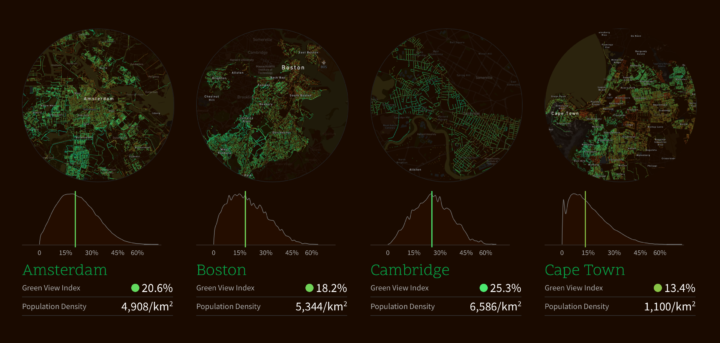
Treepedia, from the MIT Senseable City Lab, estimates perceived tree cover at the street level. They used panorama views from Google Street View to form a “Green View Index”, which they then mapped for major cities.
Treepedia measures the canopy cover in cities. Rather than count the individual number of trees, we’ve developed a scaleable and universally applicable method by analyzing the amount of green perceived while walking down the street. The visualization maps street-level perception only, so your favorite parks aren’t included! Presented here is preliminary selection of global cities.
One of my favorite childhood memories is the time I went camping and saw the Big Dipper for the first time. There weren’t any lights in the mountains to diffuse the view of the sky. Sriram Murali uses time-lapse to demonstrate. Queue the ethereal music:
[via kottke]
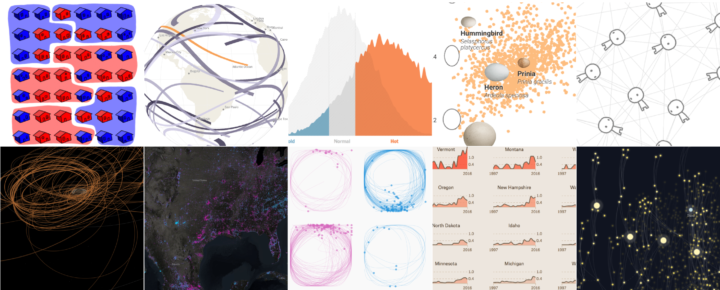
It was a rough year, which brought about a lot of good work. Here are my favorite data visualization projects of the year.
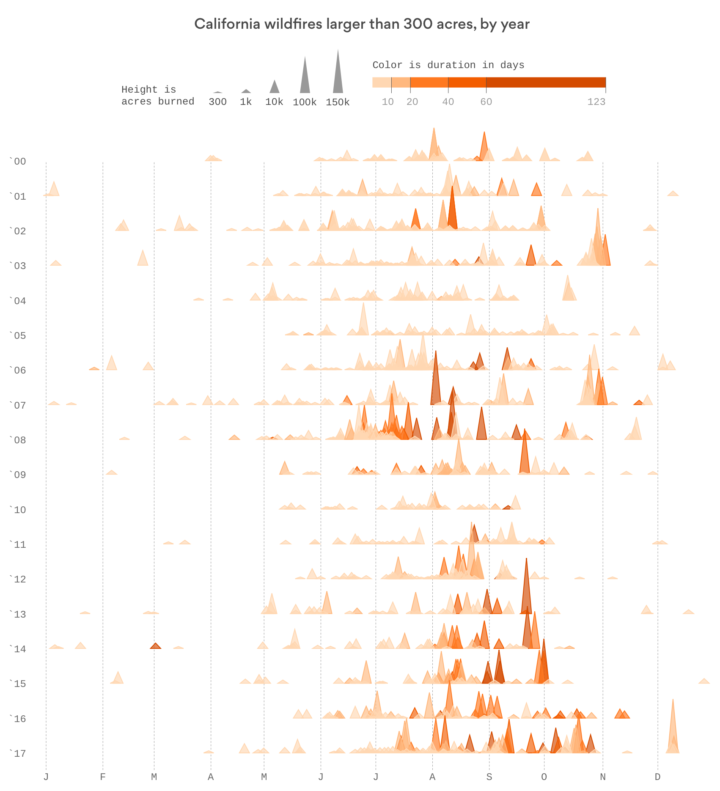
Based on data from CAL FIRE, Erin Ross, for Axios, plotted California wildfires that spanned at least 300 acres since 2000. Each triangle represents a fire, where the height represents acres burned (width is the same for all triangles) and color represents duration. The fires appear to be burning hotter and longer.
I wonder if it’s worth doubling up on the triangle encoding by using width to represent duration, similar to the Washington Post graphic made during the elections.
 Visualize This: The FlowingData Guide to Design, Visualization, and Statistics (2nd Edition)
New tools, refined process.