What Makes People the Most Happy

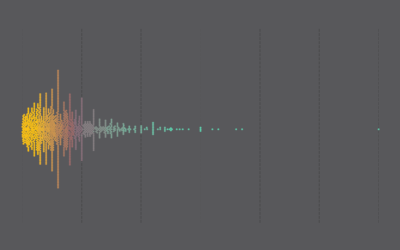
What made you happy in the past 24 hours?
Researchers asked 10,000 people this question. More specifically, the collaboration between the University of Tokyo, MIT, and Recruit Institute of Technology asked participants on Mechanical Turk to list 10 happy moments. This generated a corpus of 100,000 happy moments called HappyDB.
With how things are these days, I was happy to read over and analyze such a happy dataset.
Using (basic) natural language processing, I parsed out the main subject, verb, and object of each happy moment. My parser isn’t perfect. Only individual words are categorized rather than phrases, it only uses the first sentence in multi-sentence statements, and it tended to have difficulties with incomplete sentences.
Nevertheless, it seemed to do enough to extract patterns in all these moments. I started with a straightforward look at the most used subjects, verbs, and objects.
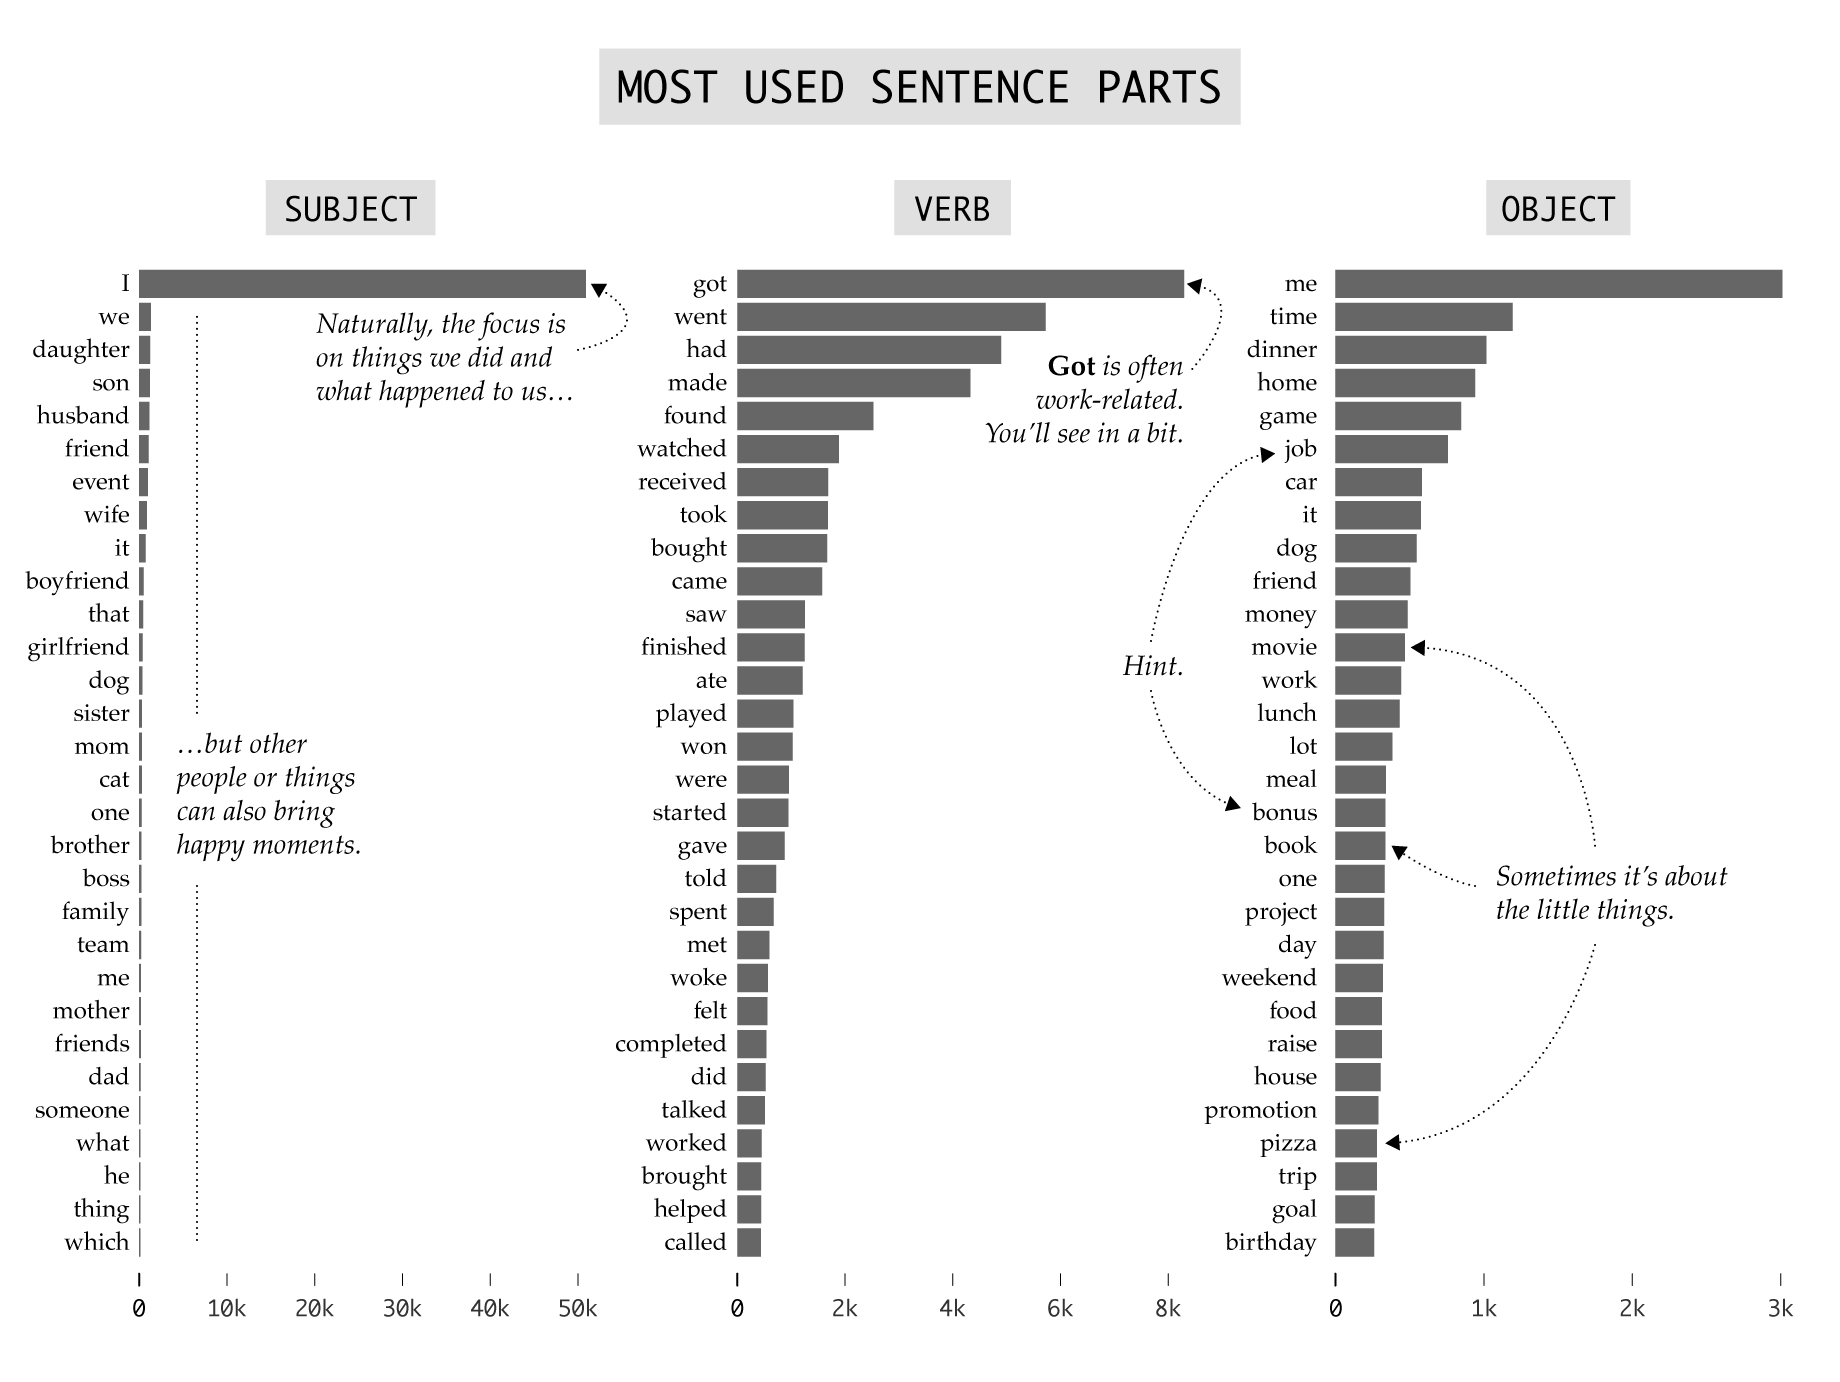
Read over the separate parts, and you get a rough idea of what these happy moments are about. As you might expect, the main subject was I in most — a bit over half — of the moments. This covers things like “I bought a new car” and “I had a good dinner”. The remaining half uses subjects that are people or things.
The separated verbs and objects provide a similarly rough idea of what makes people happy. Verbs like got, bought, and ate are easy to associate with happy times, as are objects like time, dinner, and money.
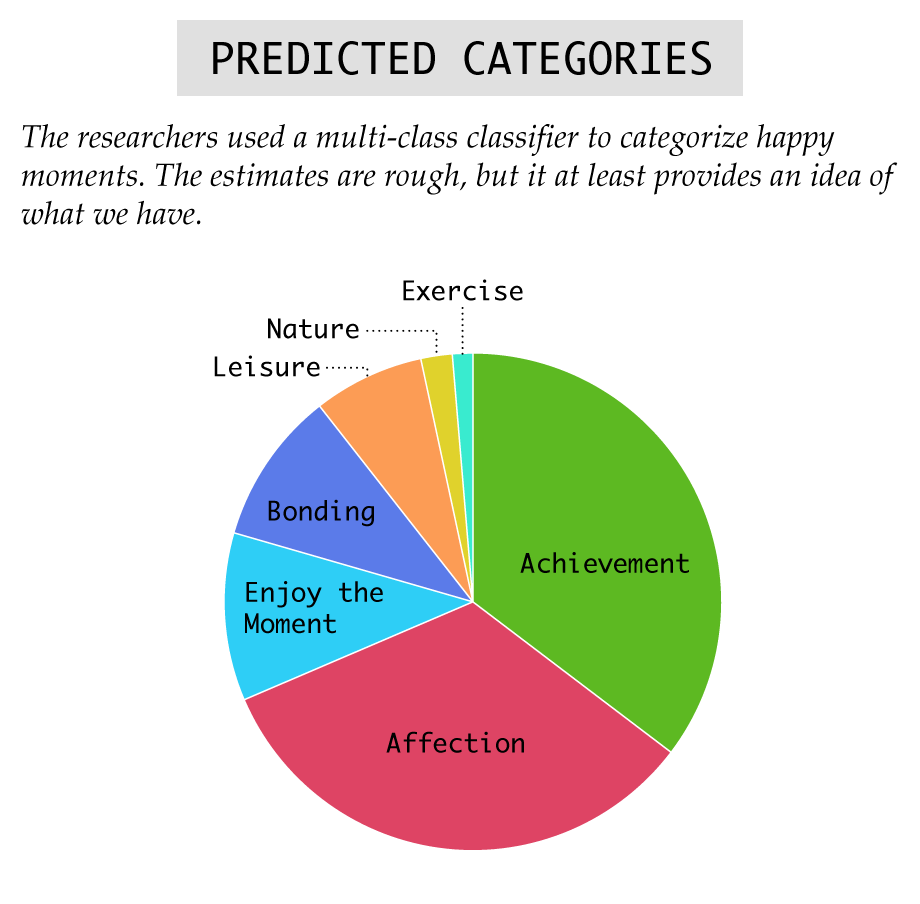
In addition to the happy moments, the dataset also provides a predicted category for each. The researchers note that the estimates are rough, but in my scans, they appear to be a decent baseline and are interesting enough to look at more closely.
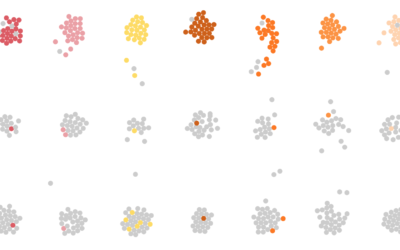
With sentences parsed into subject, verb, and object, along with predicted categories as a supplement, I explored the most common types of happy moments for different subjects. After all, moments with the self must be different from moments with a significant other or a stranger. Right?
In the charts below, I break it down for the most common subjects, such as I, we, and friend. Follow the path for the most common verbs for a subject. Then take another step for the most common objects.
I randomly selected examples for each subject-verb-object path, which are really the best part of all of this.
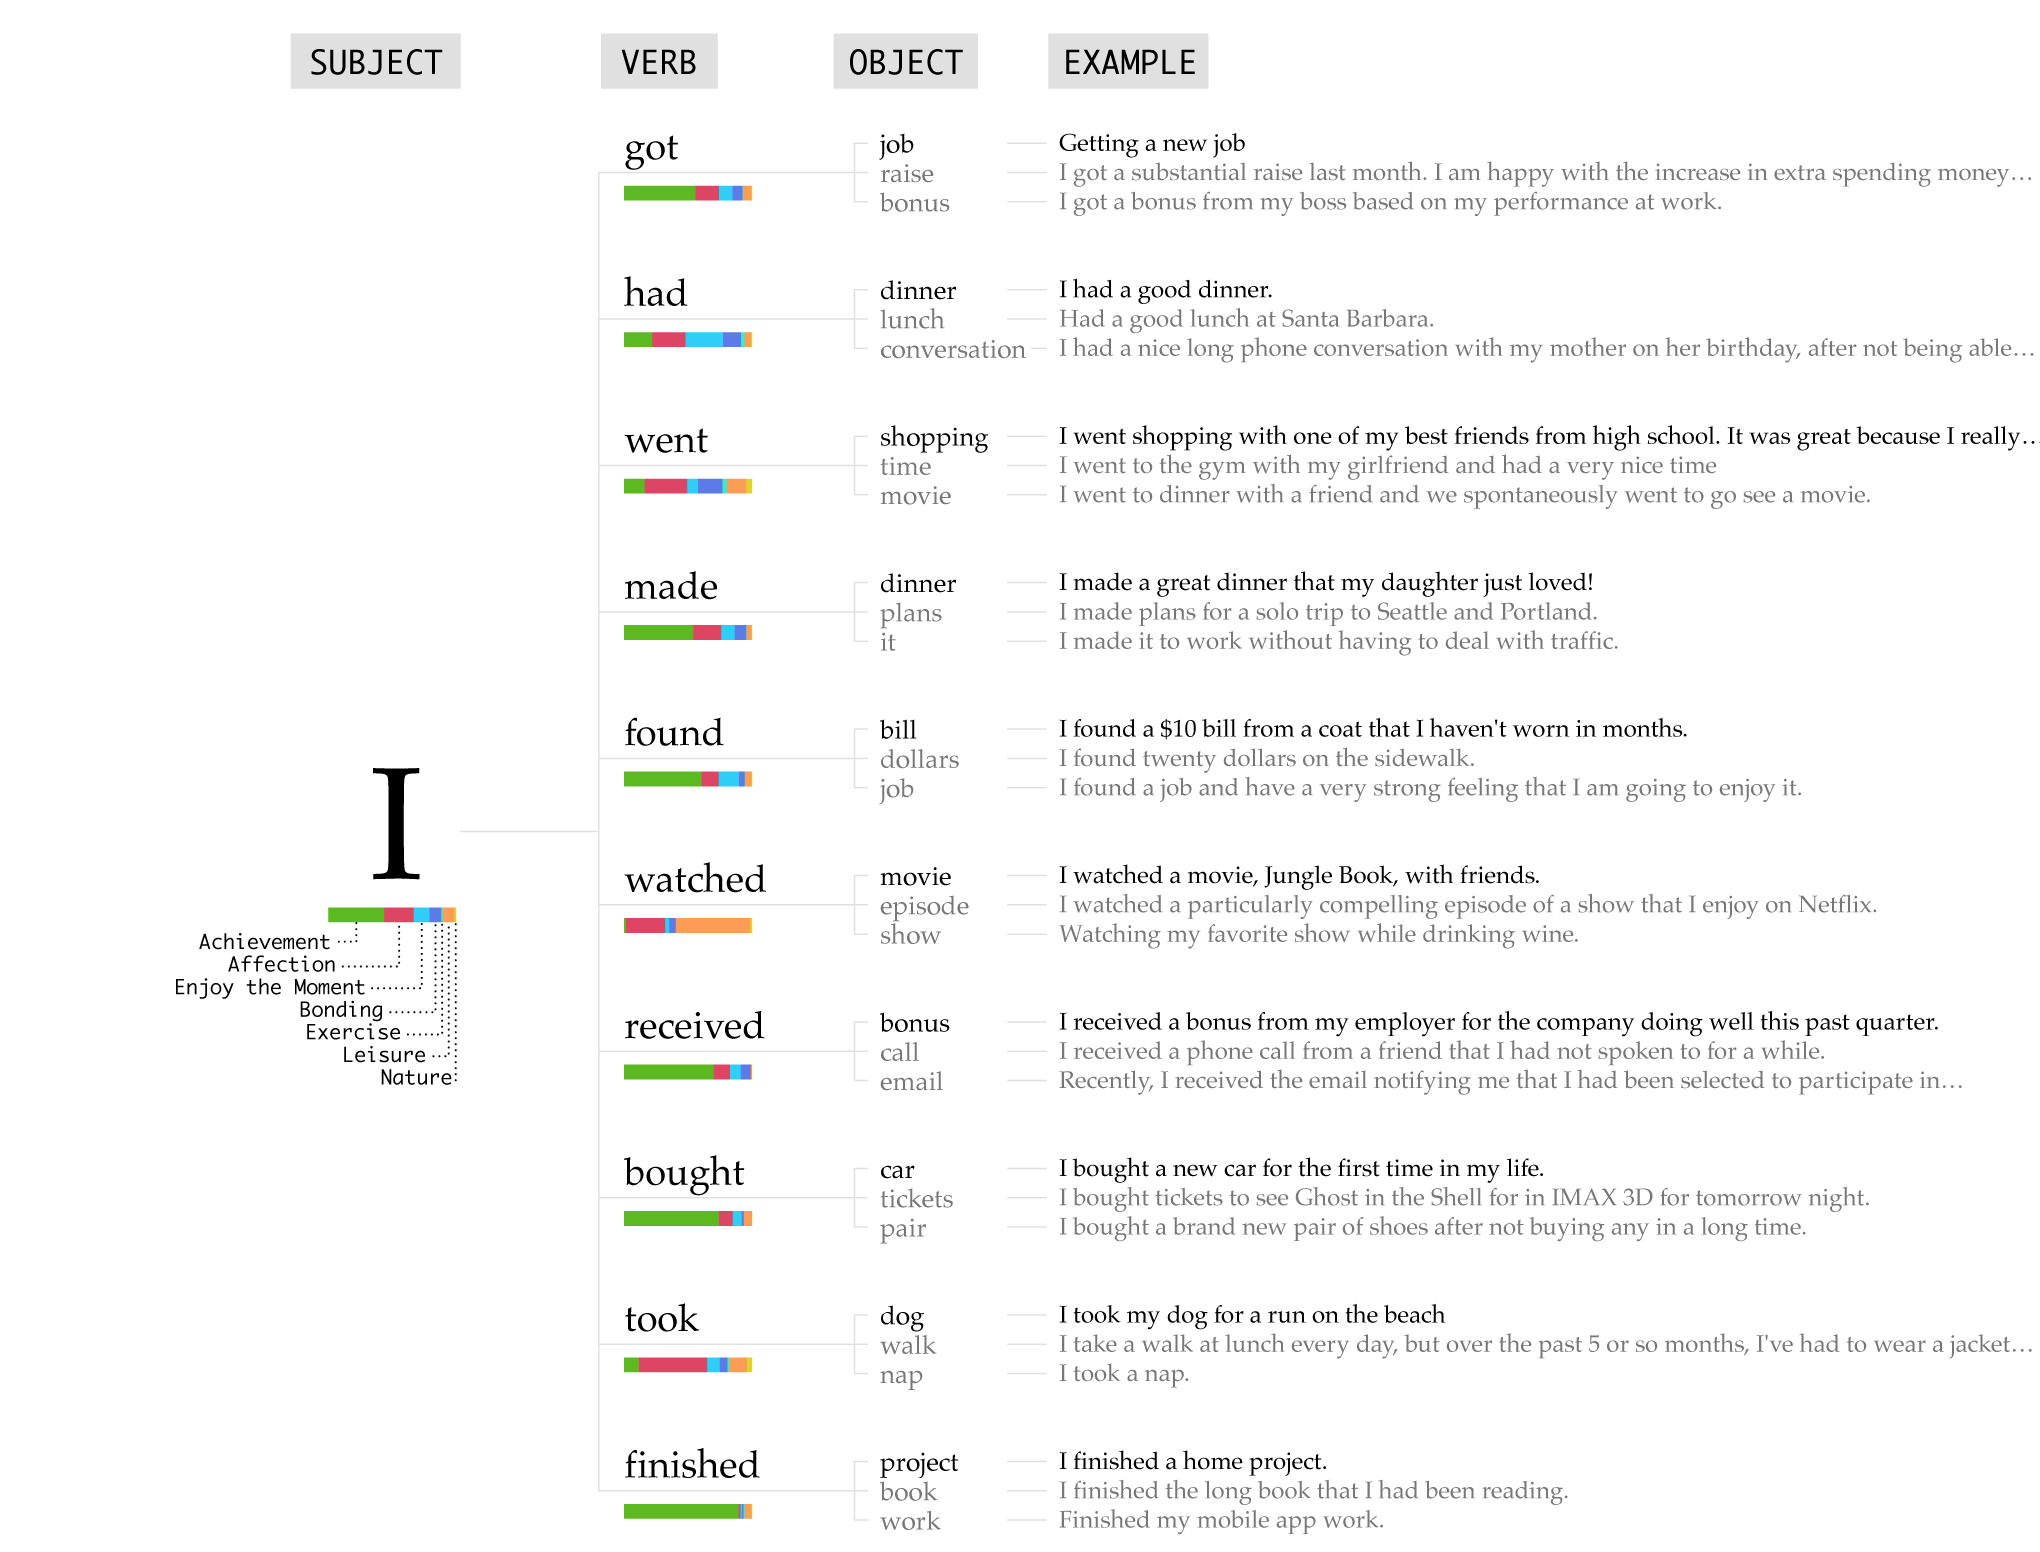
Happy moments with the subject I span the widest range of verbs and objects. The category distribution looks a lot like the overall percentages. In the most used verbs, there appears to be a focus on achievement such as getting a new job, finishing a project, or making a delicious dinner.
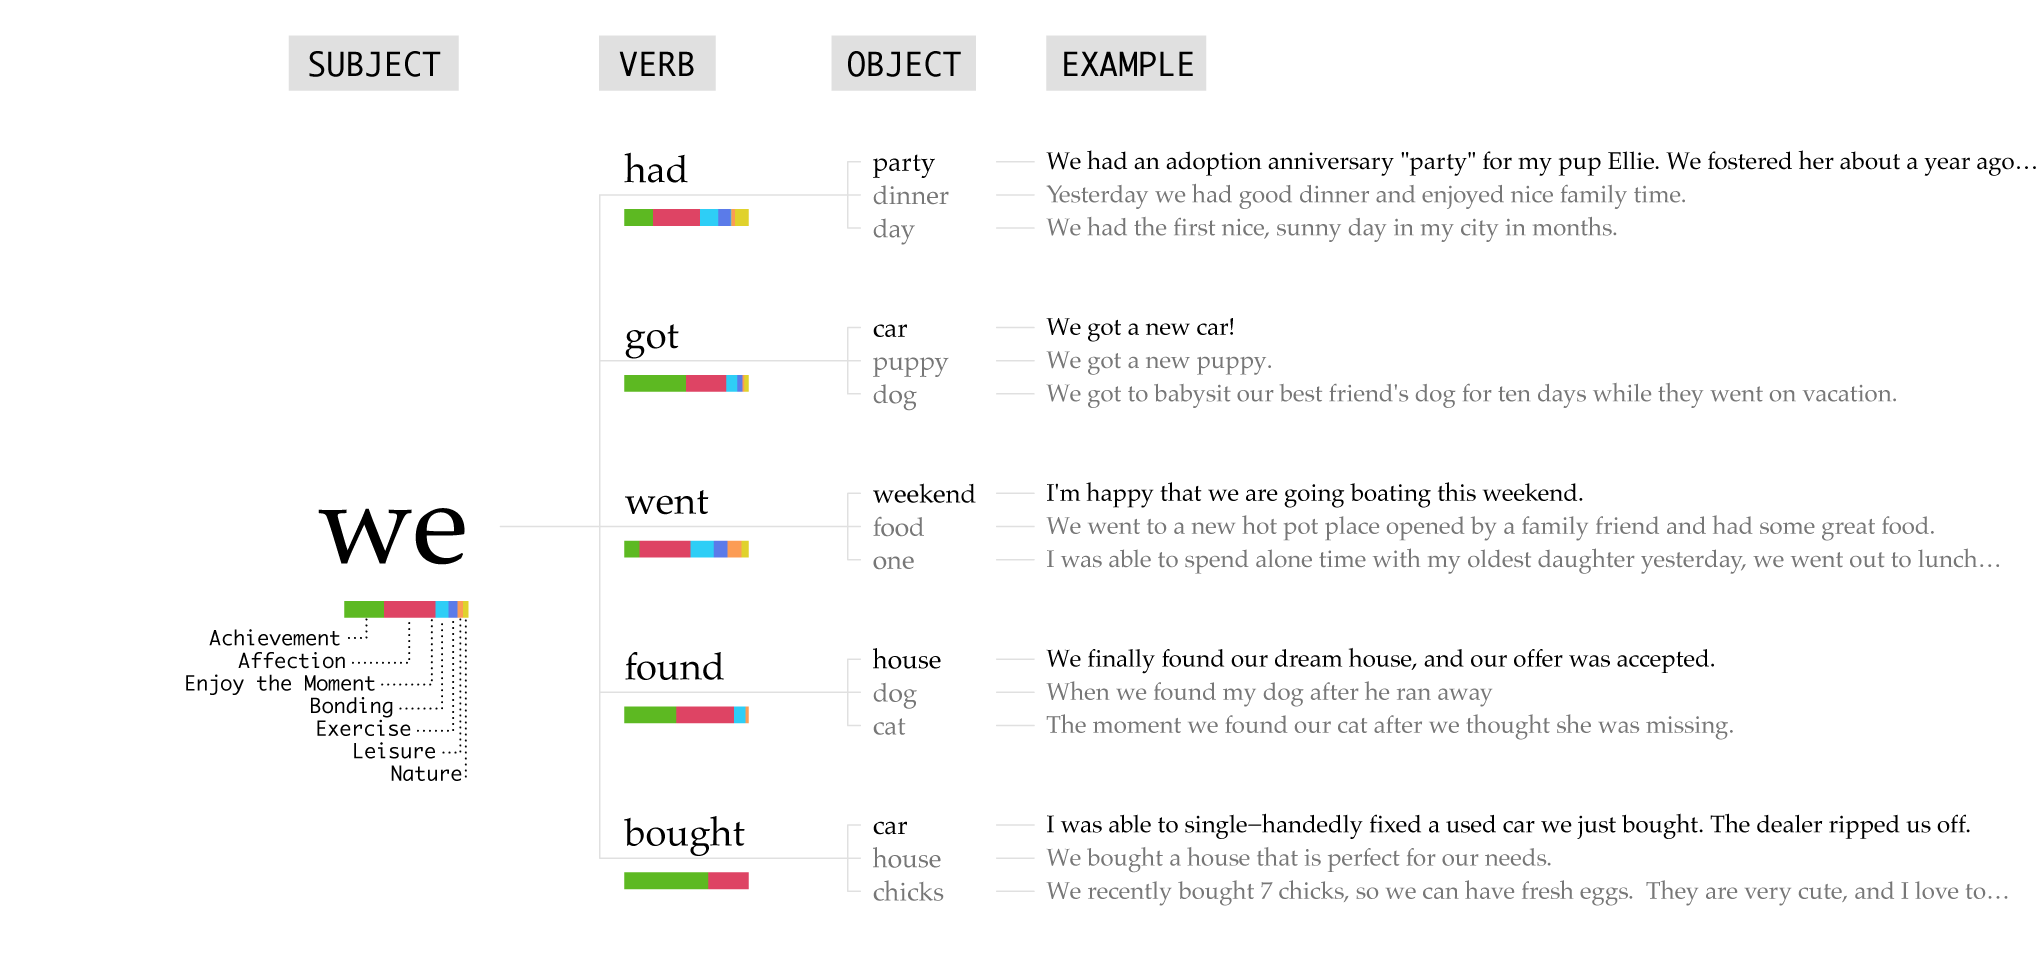
The we happy moments look similar to the I happy moments. This shouldn’t surprise since the participants are still talking about themselves.
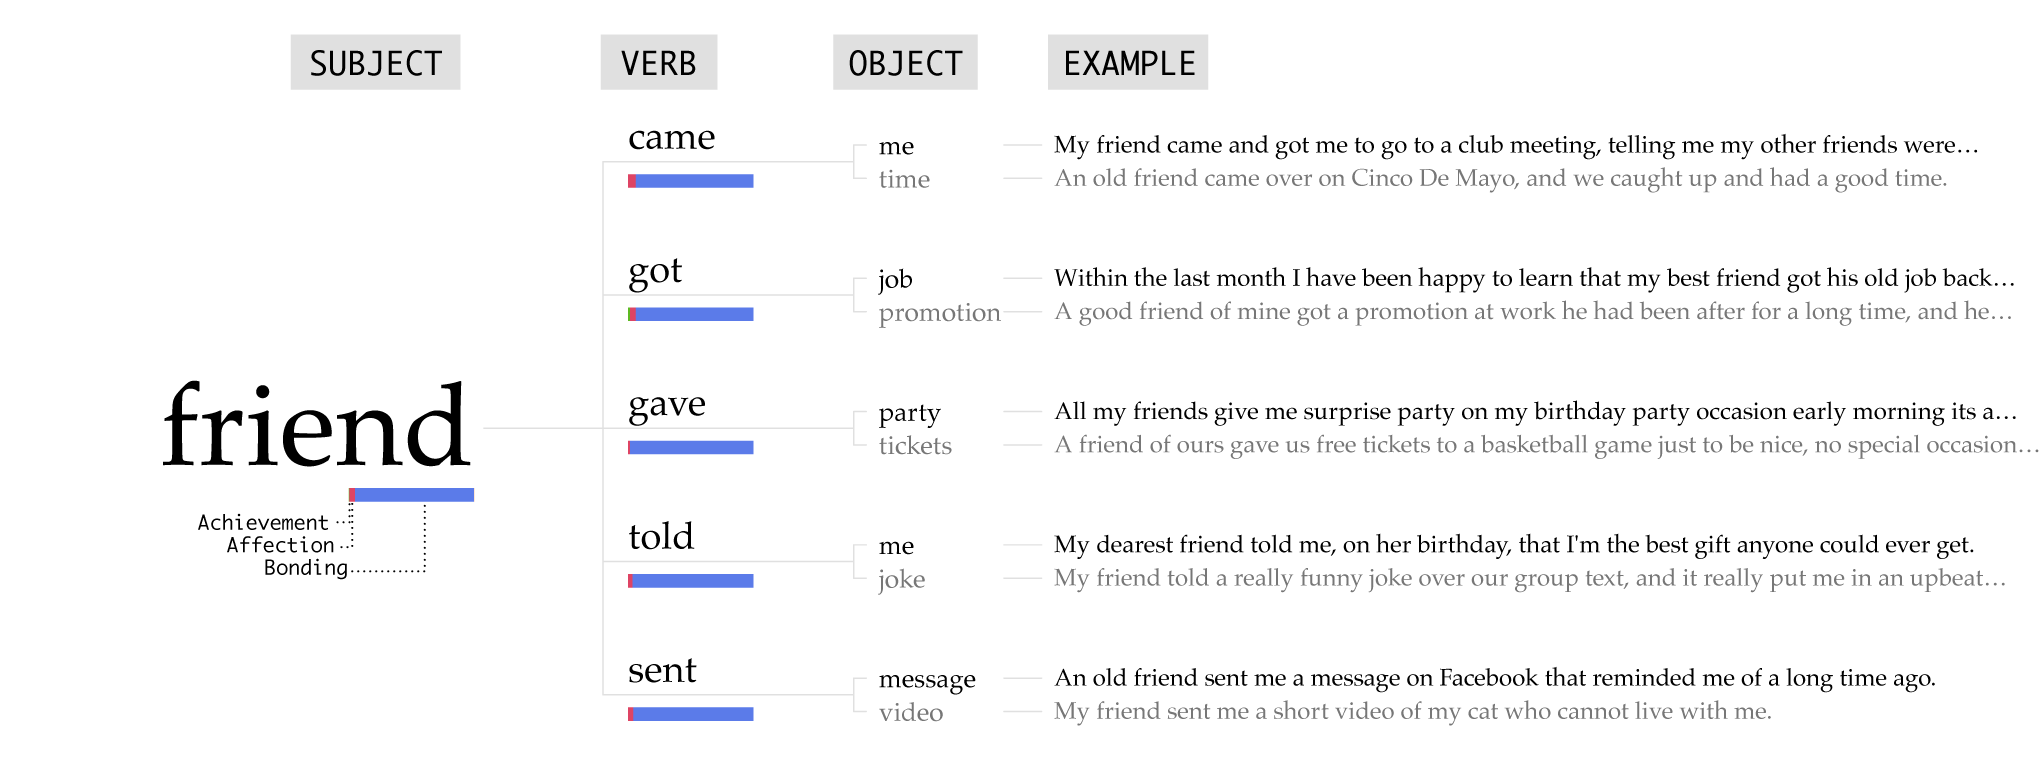
In contrast, happy moments with friend (or the plural), take on a different dynamic, because they’re about others doing something for the participant or sharing in the joy of others.
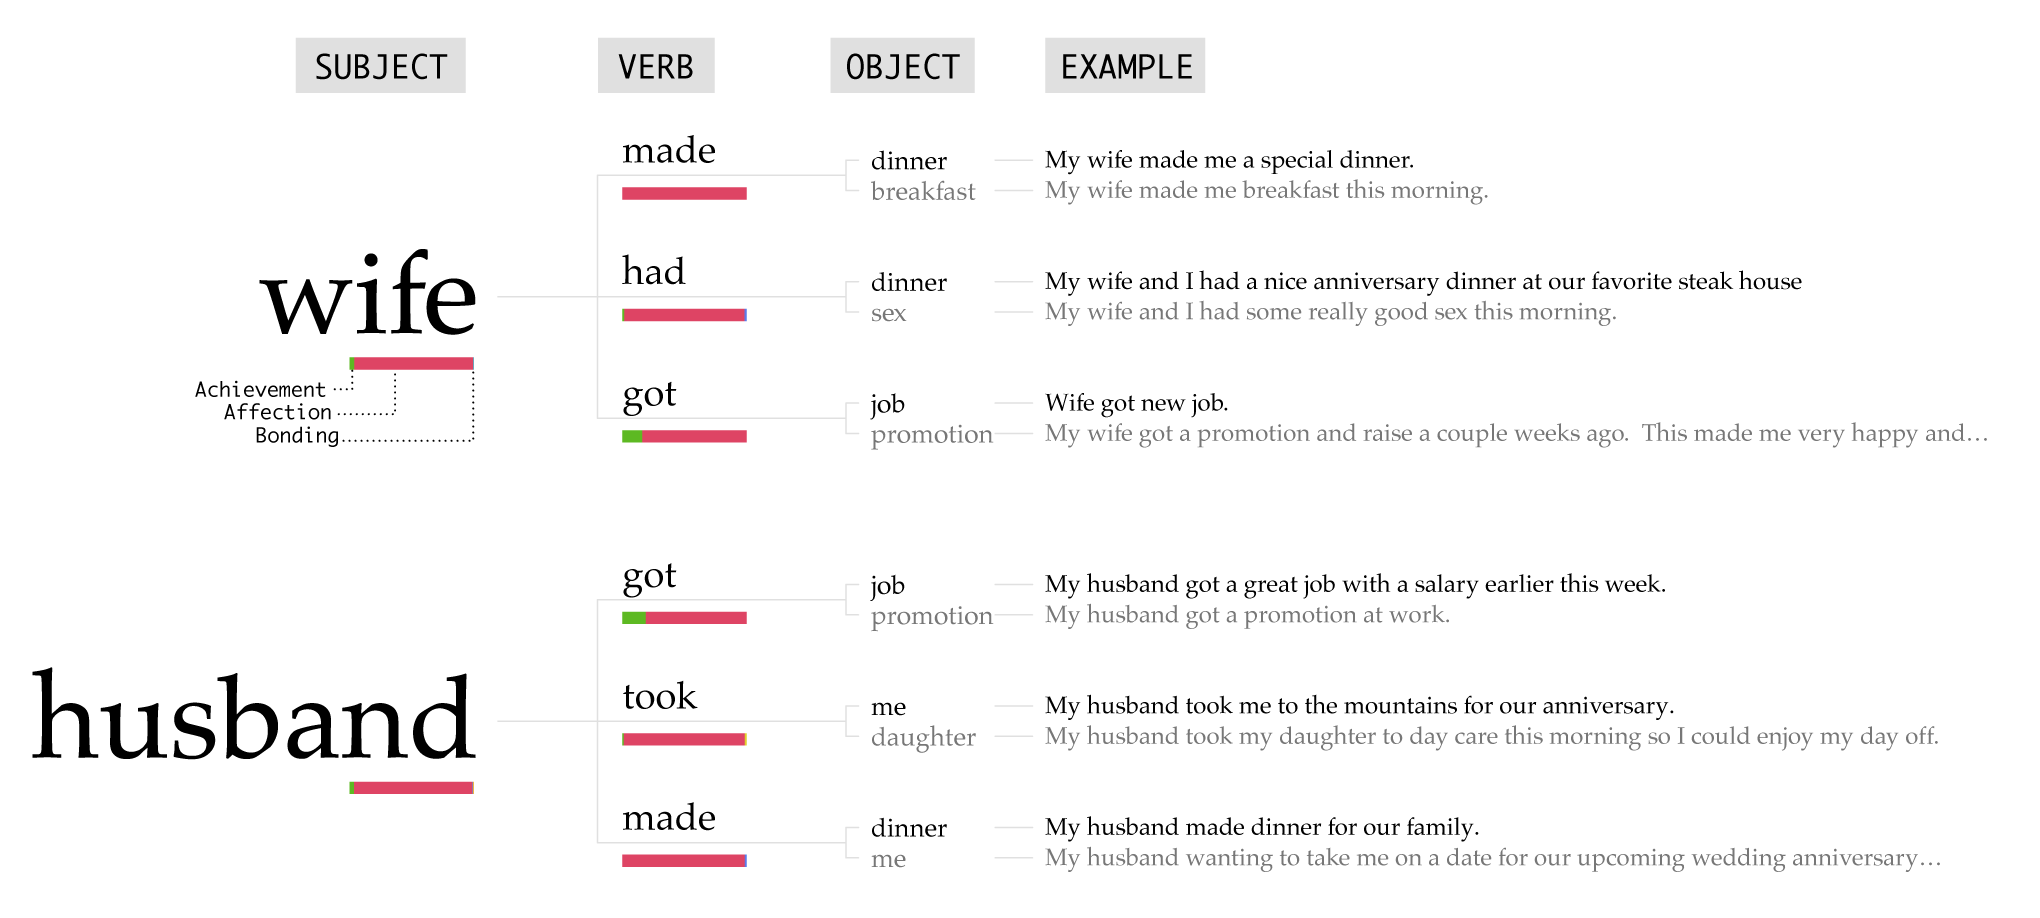
The husband and wife happy moments are similar to the friend ones, but with the added sprinkle of affection. After the overarching work-related moments, togetherness and one being there for the other lead. The boyfriend and girlfriend moments look similar.
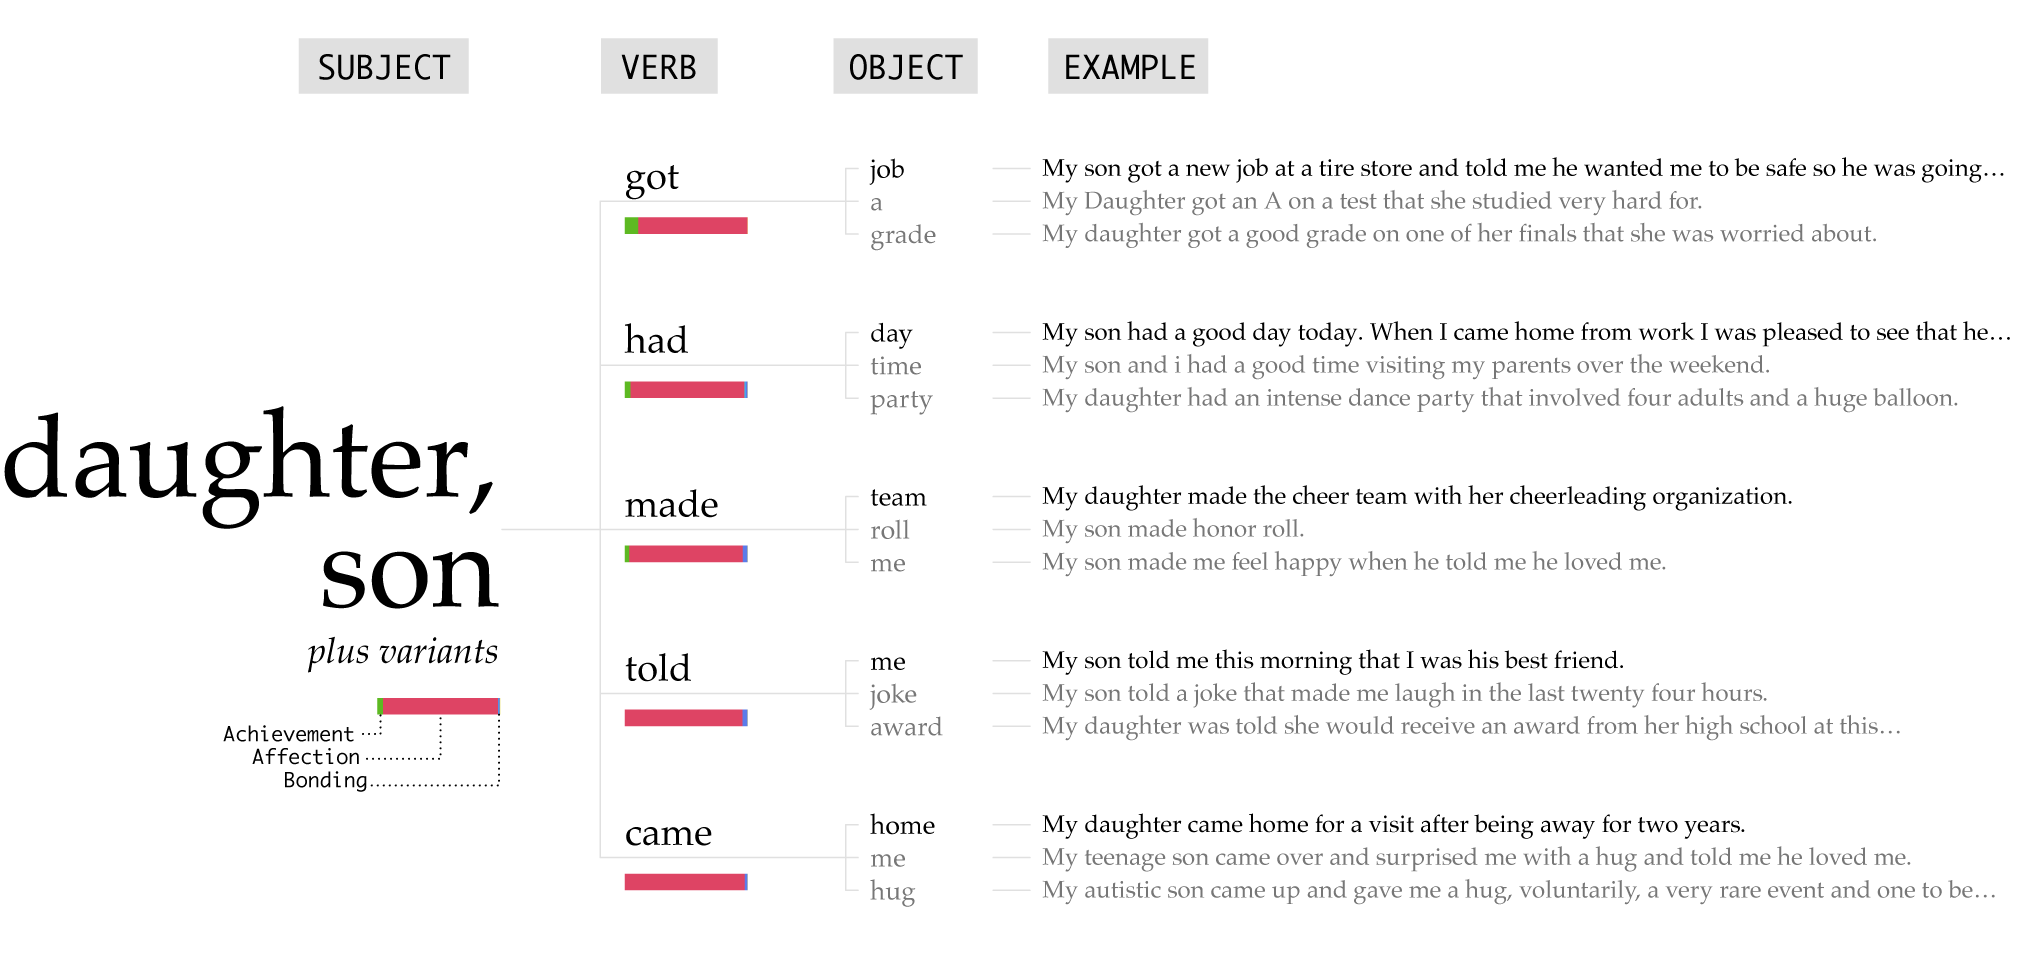
A child’s happiness is a parent’s happiness.
Kind of like children?
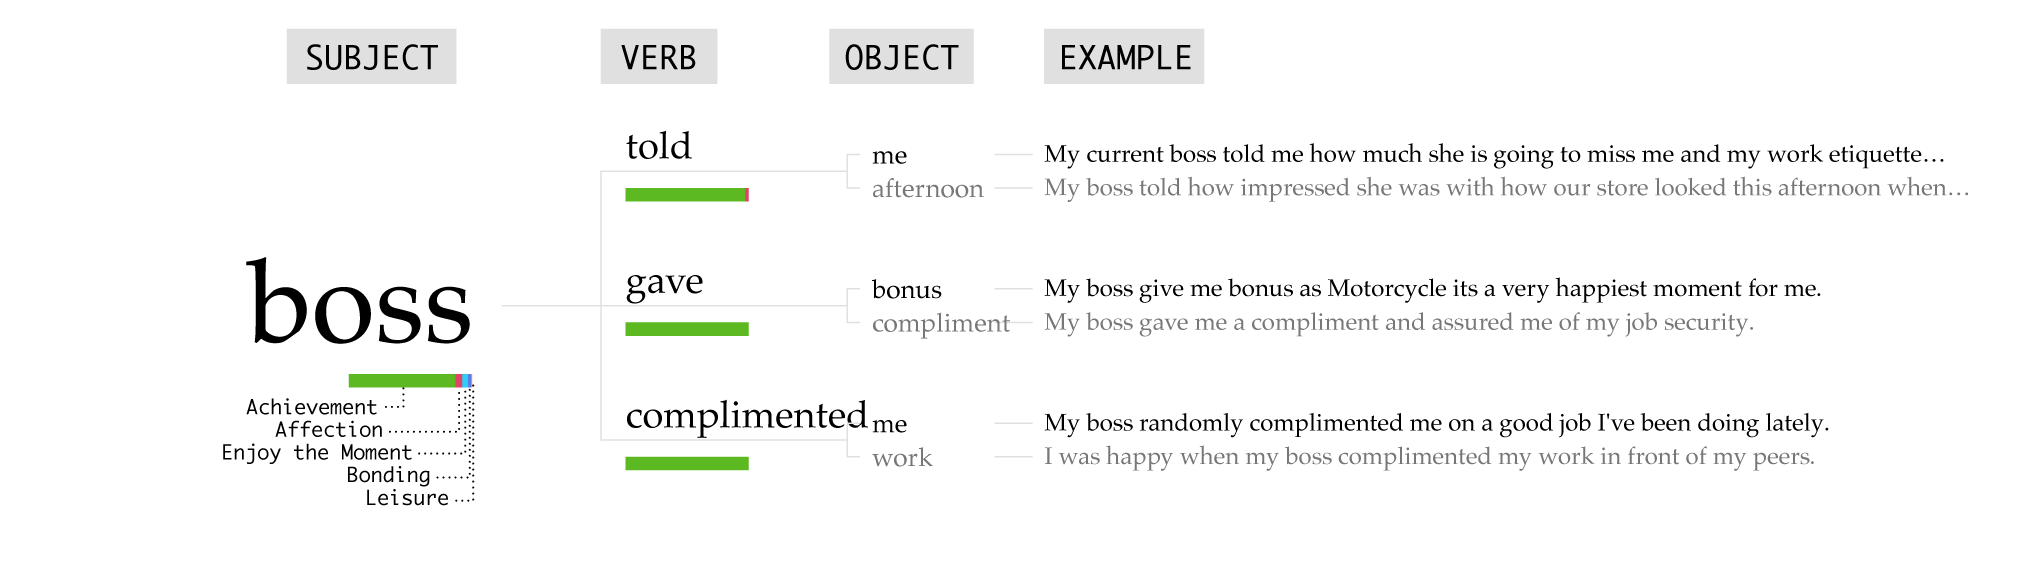
Going into full work mode, the boss enters the picture. Praise and a compliment go a long way.
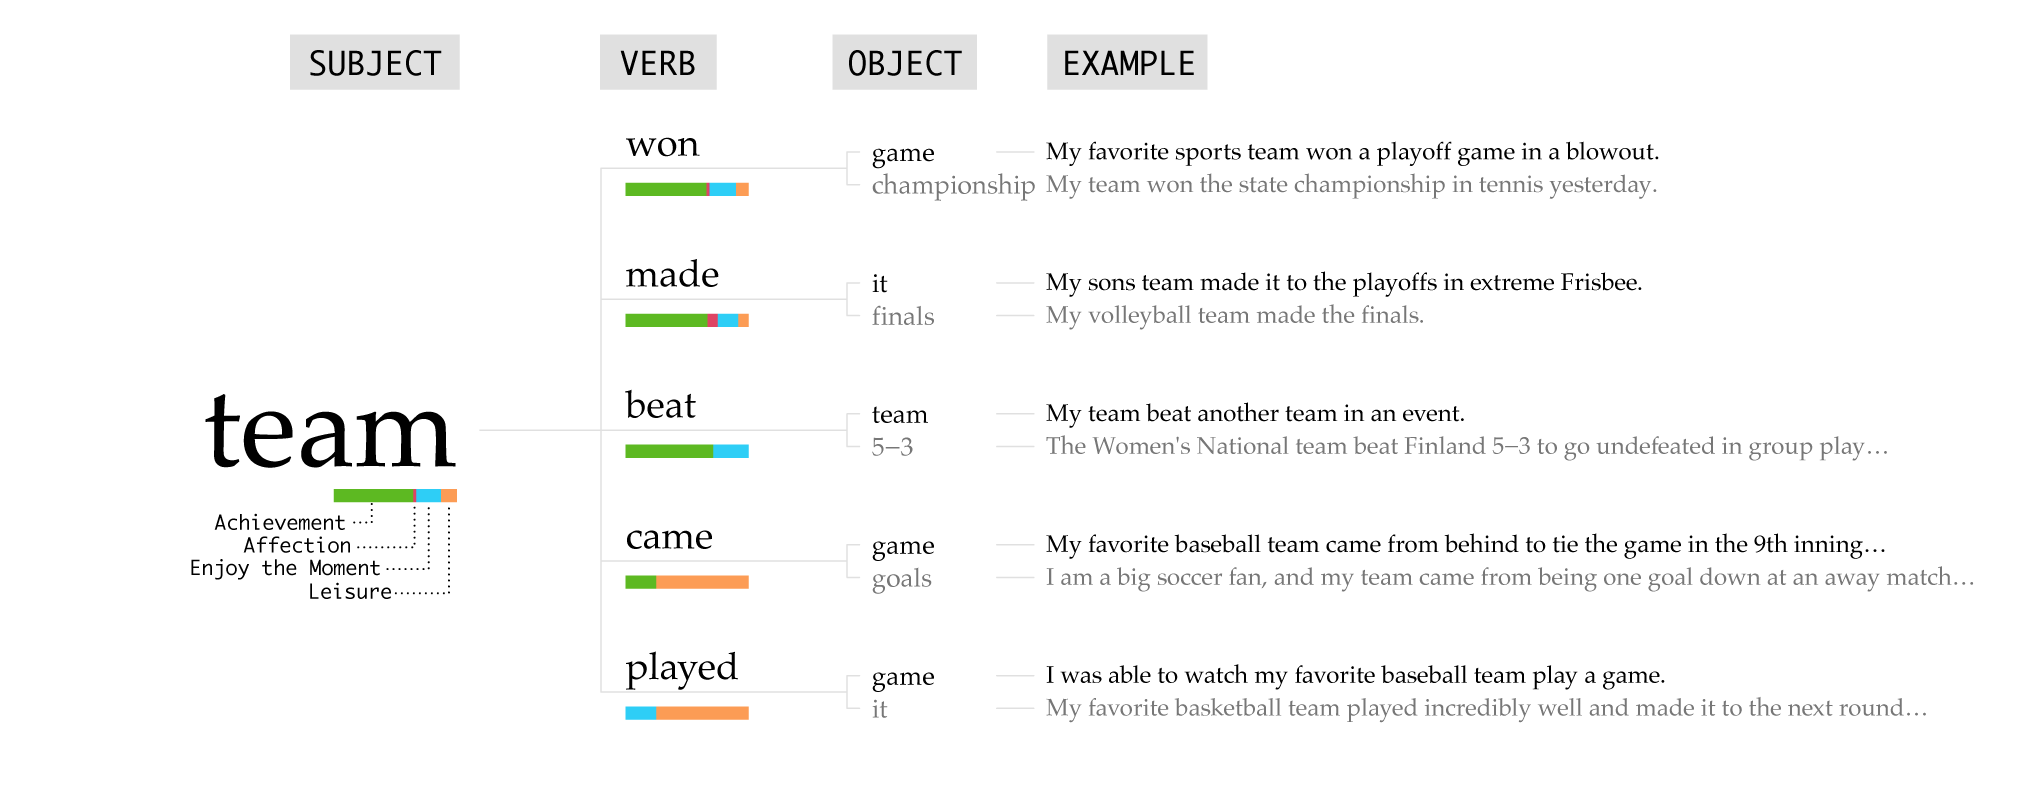
People love sports, whether it be playing or watching, and they especially enjoy winning. As they say, “Winning cures everything.” This dataset does not cover losing teams.
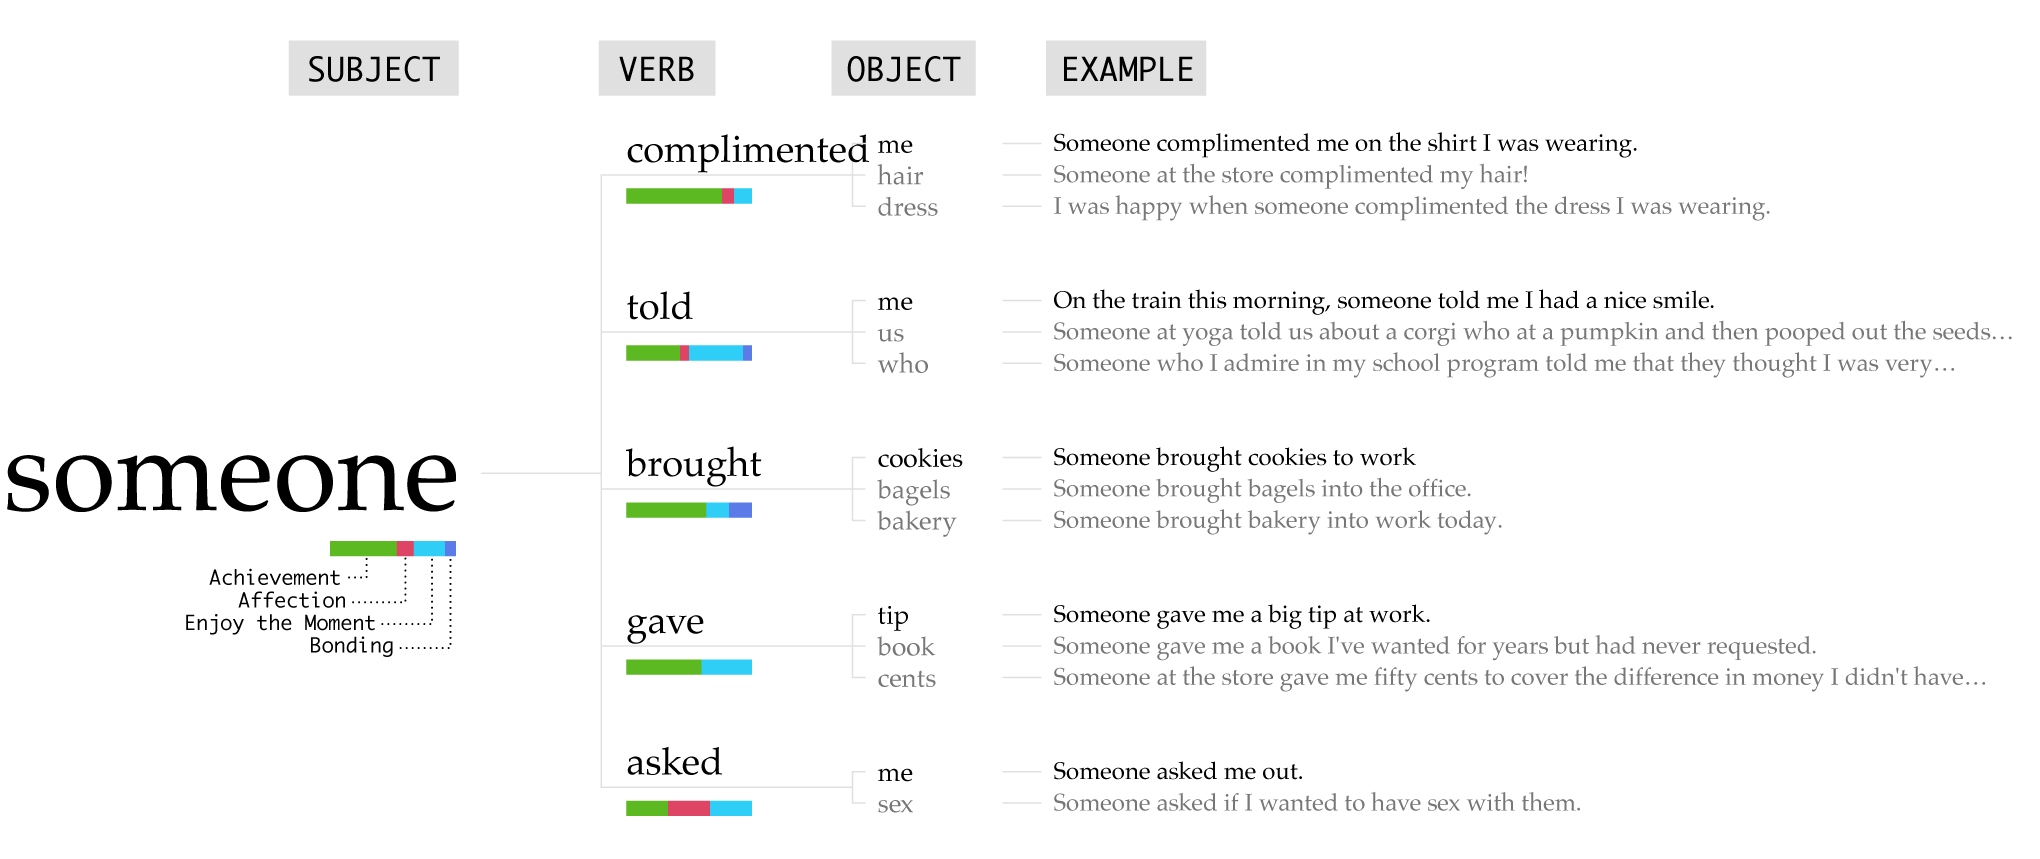
I really like the someone happy moments. With many of them, it’s about random acts of kindness that are often small and seemingly unnoticed.
Notes
- The HappyDB corpus comes from Akari Asai, Sara Evensen, Behzad Golshan, Alon Halevy, Vivian Li, Andrei Lopatenko, Daniela Stepanov, Yoshihiko Suhara, Wang-Chiew Tan, Yinzhan Xu. You can find more details on processing on the site and on GitHub.
- After some poking, I filtered down to moments from the United States. All the moments are in English, but many foreign moments were difficult to decipher. Some seemed spammy. For example, one moment was a copy and paste of a short story.
- I used the Natural Language Toolkit in Python and the Stanford Dependency Parser to identify parts of speech.
- I drew the charts in R with one-off scripts.
Become a member. Support an independent site. Make great charts.
See What You Get