Unemployment and Occupation

Unemployment is still higher than usual, and as you probably know, the shutdowns nationwide have affected industries differently. We could look at unemployment for just this year, but it’s more useful to see what the rate was for last year and compare it to this year. This gives us a baseline to compare against.

The data above comes from the Bureau of Labor Statistics.
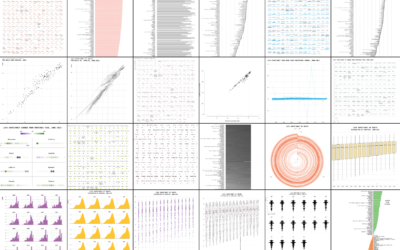

Become a member. Support an independent site. Make great charts.

See What You Get

Learn to Visualize Data See All →

How I Made That: Interactive Beeswarm Chart to Compare Distributions

The histogram is my favorite chart type, but it’s unintuitive for many. So I’ve been using the less accurate but less abstract beeswarm.

How to Make Symbol-based Glyph Charts, with R Examples

Using geometric shapes as an encoding can provide another dimension to your charts.

How to Make a Connected Scatter Plot

The combination of a time series chart and a scatter plot lets you compare two variables along with temporal changes.

Using Color Scales and Palettes in R

Color can drastically change how a chart reads and what you see in your data, so don’t leave it up to chance with defaults.

Favorites

Jobs Charted by State and Salary

Jobs and pay can vary a lot depending on where you live, based on 2013 data from the Bureau of Labor Statistics. Here’s an interactive to look.

Who is Older and Younger than You

Here’s a chart to show you how long you have until you start to feel your age.

Finding the New Age, for Your Age

You’ve probably heard the lines about how “40 is the new 30” or “30 is the new 20.” What is this based on? I tried to solve the problem using life expectancy data. Your age is the new age.

Seeing How Much We Ate Over the Years

How long will chicken reign supreme? Who wins between lemon and lime? Is nonfat ice cream really ice cream? Does grapefruit ever make a comeback? Find out in these charts.