Kirk Goldsberry, with help from Andy Woodruff, combined two joys — basketball and…
Maps
Intuitive to look at spatial patterns and great for distributing geographic data.
-

Basketball globe
-
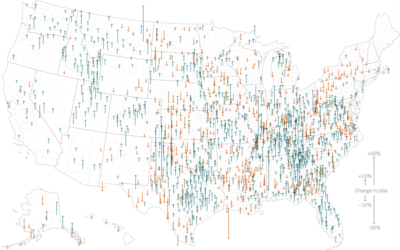
Map of job gains and losses
To show the counties with more or fewer jobs when comparing 2023 to…
-
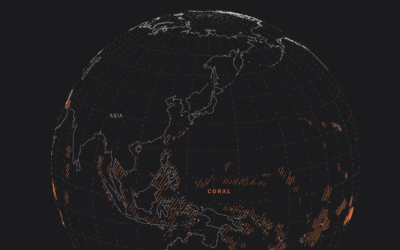
Maps of climate tipping points
The climate is changing, and researchers believe that after some point, there will…
-
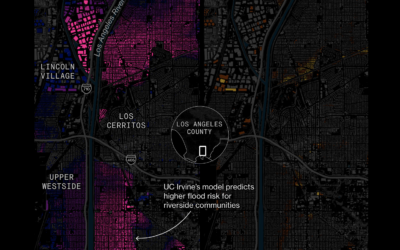
Uncertain risk behind climate change models
To demonstrate the level of uncertainty in using climate forecasting models, Bloomberg compared…
-
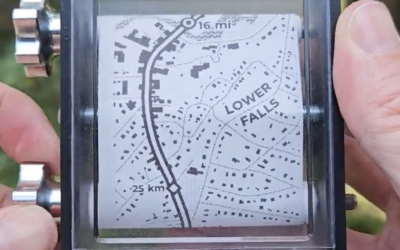
Scrolling map on receipt paper
Aaron Koelker printed a six-foot long map on receipt printer earlier this year.…
-
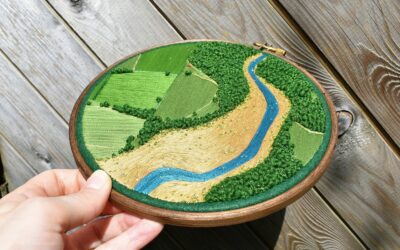
Embroidered landscapes
Victoria Rose Richards uses embroidery to depict aerial views and landscapes. The above…
-

Overlap between area codes HTTP response headers
Like many, you’ve probably wondered what HTTP response headers are also area codes…
-
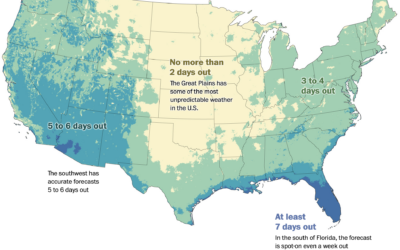
Accuracy of temperature forecasts where you live
You’ve probably noticed that the weather forecast can change a lot for predictions…
-
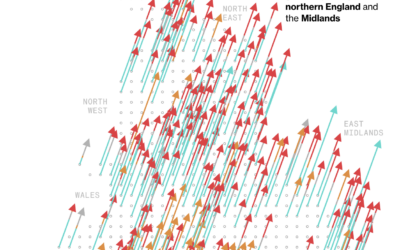
UK party gains and winners
Speaking of Conservatives losing, Andre Tartar and Demetrios Pogkas for Bloomberg show the…
-

Seeing the world after Google Streetview
Trevor Rainbolt is really good at geolocating a place given a single frame…
-
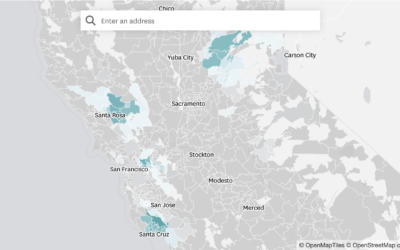
Where State Farm Insurance is dropping home policies
State Farm won’t be renewing about 30,000 policies because of high wildfire and…
-
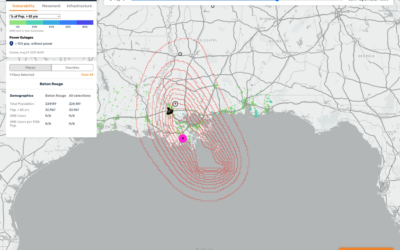
Mapping hurricane winds with avocado of uncertainty
Stamen, whose design breakdowns I always appreciate, discusses why they took a different…
-
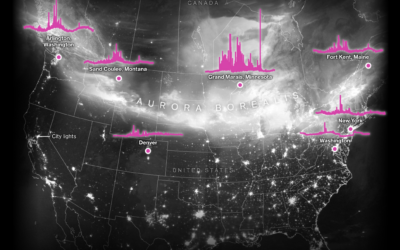
Energy surges due to solar storm
The recent solar storms brought pretty lights to the night sky in some…
-
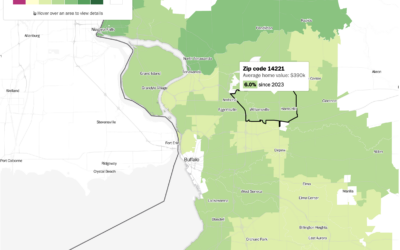
Change in housing prices where you live
I don’t know about you, but where I live, the housing prices keep…
-
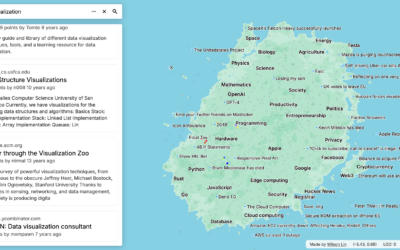
Mapping Hacker News
Wilson Lin used an abstract map to visualize 40 million posts and comments…
-
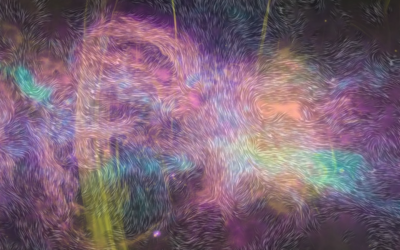
Map of magnetic fields in the Milky Way
Based on data from NASA’s Stratospheric Observatory For Infrared Astronomy (SOFIA), Villanova University…
-
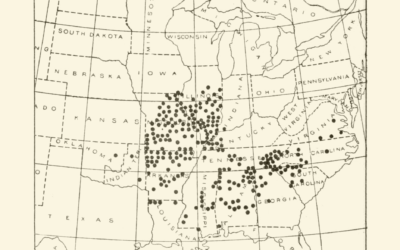
Historical cicada maps
It’s been over 200 years since the cicadas of Brood XIII and Brood…
-
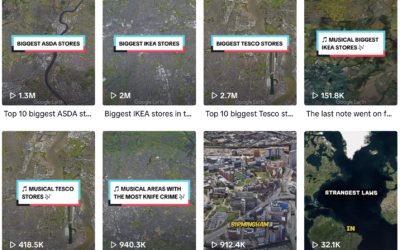
Welcome to the future of data reporting, in musical format
The TikTok account Globetrots combines Google Earth and text-to-speech to show top-ten lists…
Recently for Members
Second Edition
 Visualize This: The FlowingData Guide to Design, Visualization, and Statistics (2nd Edition)
 Visualize This: The FlowingData Guide to Design, Visualization, and Statistics (2nd Edition)
New tools, refined process.
Browse by Chart Type See All →


