I’m not exactly sure what I’m seeing here, but Voyage, by Andy Biggs,…
Data Art
Finding the beauty in numbers.
-
Explore Your Feeds in a Cloud of Posts – RSS Voyage
-
Mmm, Chocolate Pie… Chart
In the spirit of turning pie charts into food, Mary and Matt kick…
-
Word Portraits of Famous People – Einstein and Ginger the Cockapoo
Jeff Clark of Neoformix has been doing some cool stuff with words lately.…
-
Showing This Many Per Second – Data Humanized
I’ve always thought one of the best ways to make data relate-able is…
-
A Bunch of Japanese Women’s Bra Responses
Uniqlo gathered hundreds of responses from a couple hundred Japanese women about bra…
-
Daily Design Workout – DONE by Jonas Buntenbruch
DONE is a sketching project by Jonas Buntenbruch. He takes 30-60 minutes per…
-
Doodle Your Way Through the News – DoodleBuzz
I feel like I’ve been seeing and writing a lot about artistic visualization…
-
Visualization Workshop in Madrid – Database City
It’s hard to believe that it’s been almost a year since I was…
-
Beautiful Generative Computer Art – Metamorphosis
Glenn Marshall has released his finished version of Metamorphosis, a beautiful piece of…
-
Art of Mathematics – Visualization of Dynamical Systems
Dynamical systems are mathematical models used to describe the time-dependent position of a…
-
Fleshmap: Studies of Desire – Touch, Look, and Listen
Fleshmap is a new project by Martin Wattenberg and Fernanda Viégas that explores…
-
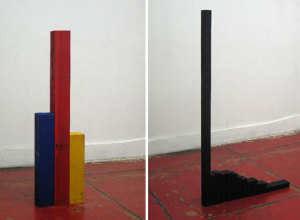
Physical Graphs as Critique on American Culture
These wooden graphs by Joshua Callaghan show uh, something on the left and…
-
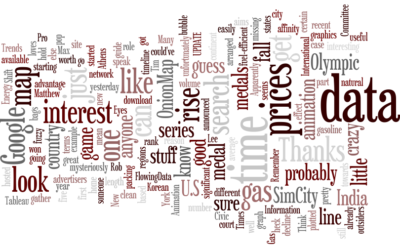
Many Eyes Adds Wordle to its Extensive Visualization Toolbox
I’m sure you’ve seen Wordle by now, which puts an artistic spin on…
-
What Kind of Information is Hidden in Barcodes?
Barcodes. We all know what they look like. They’re the black stripes that…
-
Martin Wattenberg On Visualizing Large Textual Data
Martin Wattenberg, one of the creators of Many Eyes, in reply to “Why…
-
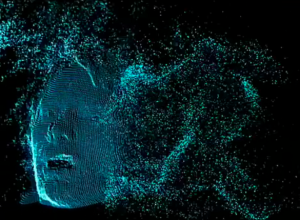
Radiohead Music Video by Capturing and Rendering 3D Data
Radiohead’s most recent music video, House of Cards, was made entirely without cameras.…
-
Hacking the Coffee Maker – Caffeine Viewer
The colmeia group recently installed their Caffeine Viewer project where they hacked their…
-
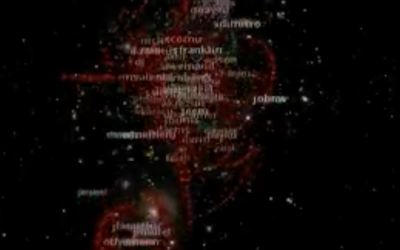
An Experiment in Organic Software Visualization
This organic visualization, code_swarm by Michael Ogawa from UC Davis, has been making…
Recently for Members
Second Edition
 Visualize This: The FlowingData Guide to Design, Visualization, and Statistics (2nd Edition)
 Visualize This: The FlowingData Guide to Design, Visualization, and Statistics (2nd Edition)
New tools, refined process.
Browse by Chart Type See All →


