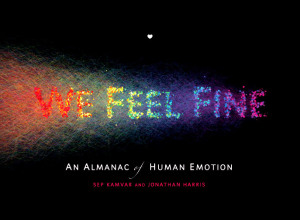
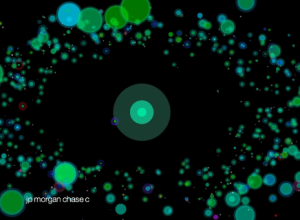
We Feel Fine, by Sep Kamvar and Jonathan Harris, is a selection of some of the best entries from the database of 12 million emotions, along with some insights into the growing dataset.
Data Art
Finding the beauty in numbers.
-
Review: We Feel Fine (the book) by Kamvar and Harris
-
Math Functions in the Real World
RIT student Nikki Graziano photographs math functions in the real world. Some are…
-
Save pens. Use Garamond font
Designers Matt Robinson and Tom Wrigglesworth looked at ink usage of some commonly-used…
-
Data Visualization Christmas Ornaments
It’s funny how data is finding it’s way into everyday objects. There was…
-
The Decline of Maritime Empires
This experiment (below) by graduate student Pedro Miguel Cruz shows the decline of…
-
When Twitter Says Good Morning Around the World
Jer Thorp, an artist and educator from Vancouver, Canada, visualizes when people “wake…
-
The S&P 500 as a Planetary System
The Stock Ticker Orbital Comparison, or STOC for short, from media student James…
-
2009 MTV VMA Twitter Tracker Live
The 2009 MTV Video Music Awards are on right now (and I’m sure…
-
Ben Fry Visualizes the Evolution of Darwin’s Ideas
Ben Fry, well-known for Processing and plenty of other data goodness, announced his…
-
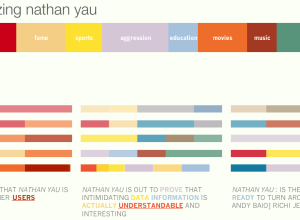
How Does the Internet See You? – Personas From MIT Media
I Google myself every now and then. Everyone does. I don’t know why…
-
Map/Territory Shows Augmented Reality of the Future
Map/Territory, by designer Timo Arnall, is a concept video of what it might…
-
Colored Tree, Cookies, and Stairs in Visualization Ad
These ads for Hospital Alemán from Saatchi & Saatchi color code physical items…
-
Designing Interfaces for the Star Ship Enterprise
We’ve all seen the new Star Trek by now. If you haven’t, you…
-
Pixel City: Computer-generated City
Pixel City is a procedurally-generated city by Shamus Young. For the non-coders out…
-
Creating a World in Holograms
This holographic video by Bruce Branit is completely fictional but oh so sexy.…
-
Web Trends Map from Information Architects, 4th edition
Information Architects, a design firm with offices in Japan and Zurich, release their…
-
One Song Sang By 2,088 Voices – Mechanical Turk Rendition
Aaron Koblin and Daniel Massey team up to give us Bicycle Built for…
-
Review: Data Flow, Visualizing Information in Graphic Design
Data Flow: Visualizing Information in Graphic Design isn’t an Edward Tufte book. It’s…


 Visualize This: The FlowingData Guide to Design, Visualization, and Statistics (2nd Edition)


