Damien Hirst is an artist known for a number of works, one of…
Statistical Visualization
Finding patterns, distributions, and anomalies.
-
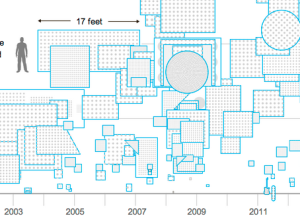
Price of Damien Hirst spot paintings →
-
Link
Visualising data with ggplot2
Hadley Wickham gives a two-hour video tutorial on how to use his ggplot2 package in R. I have limited experience with it, but a lot of people really like it and use the package exclusively for their visual analysis needs.
-
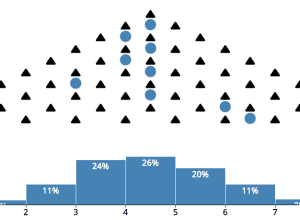
Central limit theorem animation
The central limit theorem:
In probability theory, the central limit theorem (CLT) states… -
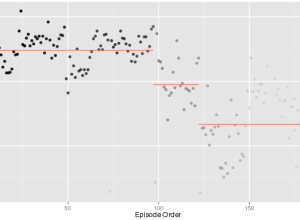
Ratings of TV shows over time
The quality of television shows follow all kinds of patterns. Some shows stink…
-
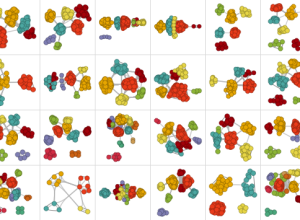
A thorough Facebook analysis by Stephen Wolfram
Stephen Wolfram analyzed the Facebook world, based on anonymized data from the Wolfram|Alpha…
-
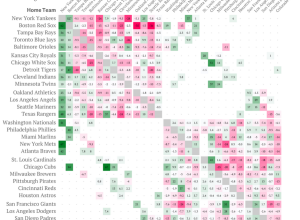
Analysis of baseball ticket pricing
If you’ve ever looked at ticket prices for sporting events, you probably noticed…
-
Chartspotting: Coffee graph menu
FlowingData reader Amir sent this along. In lieu of a list of coffee…
-
Internet Census
Upon discovering hundreds of thousands open embedded devices on the Internet, an anonymous…
-
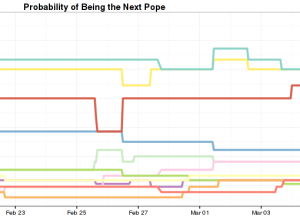
Bettings lines for becoming the next pope
Who’s going to be the next pope? I know all of you are…
-
Link
Chart Check: Did Obama’s Graphics ‘Enhance’ His Big Speech? →
Helped out some for this NPR article
-
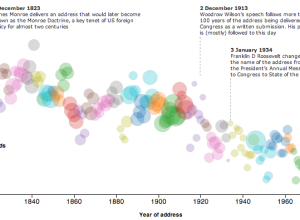
State of the Union address decreasing reading level →
With the State of the Union address tonight, The Guardian plotted the Flesh-Kincaid…
-
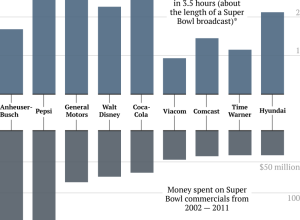
Super Bowl ad costs vs. company profit during game
Ritchie King for Quartz compared money spent on Super Bowl ads — now…
-
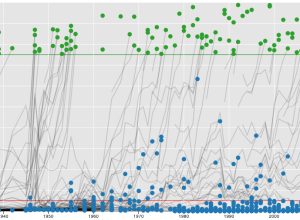
Baseball Hall of Fame voting trajectories
Carlos Scheidegger and Kenny Shirley, along with Chris Volinsky, visualized Major League Baseball…
-
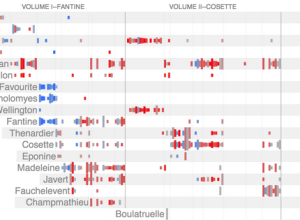
Character mentions in Les Miserables
Jeff Clark took a detailed look at Victor Hugo’s Les Miserables via character…
-
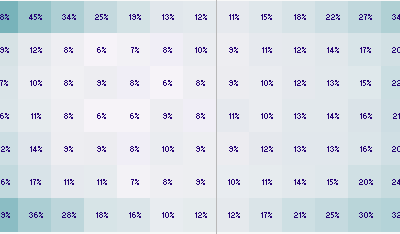
Five years of traffic fatalities
I made a graphic a while back that showed traffic fatalities over a…
-
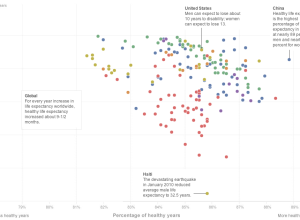
Longer life expectancy, more years of disease
Bonnie Berkowitz, Emily Chow and Todd Lindeman for the Washington Post plotted life…
-
Link
Small multiples with details on demand →
Small charts. Click. Big chart.
-
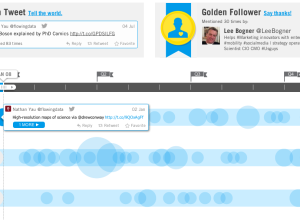
Get a visual recap of your year on Twitter
As 2013 nears, let the recaps, reviews, and best ofs begin. Twitter put…



 Visualize This: The FlowingData Guide to Design, Visualization, and Statistics (2nd Edition)


