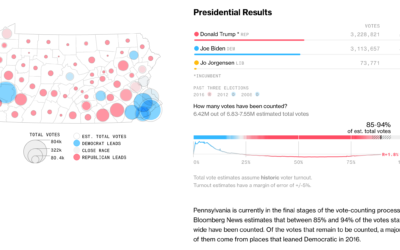
Still waiting for those results? Bloomberg’s election page for each state shows the…
Statistical Visualization
Finding patterns, distributions, and anomalies.
-
Watch the election percentages for votes counted so far
-
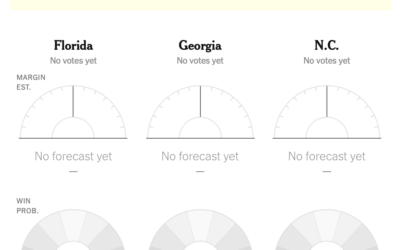
Election needles are back
The NYT election needles of uncertainty are back, and they’re about to go…
-
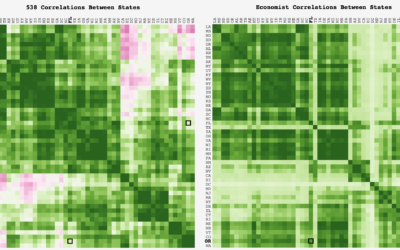
Comparing correlation in the FiveThirtyEight and Economist election forecasts
FiveThirtyEight and The Economist take similar inputs but output different forecasts. Adam Pearce…
-
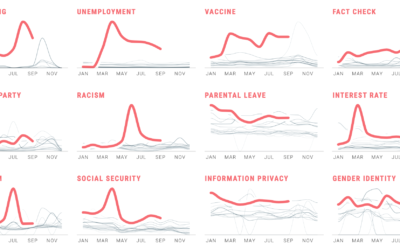
Political search interest in 2020
In Waves of Interest, a collaboration between the Google News Initiative and Truth…
-
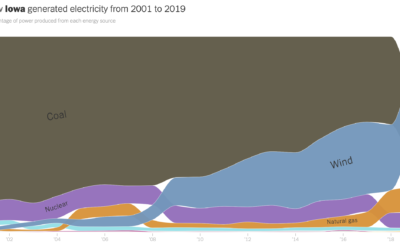
How your state makes electricity
The way we make electricity in America is changing. For The New York…
-
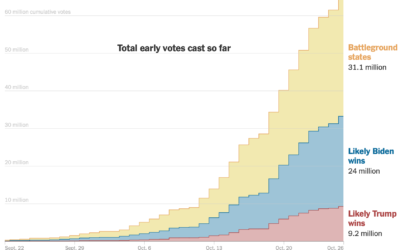
Early voting volumes
As you might expect, early voting volume is high across the country. In…
-
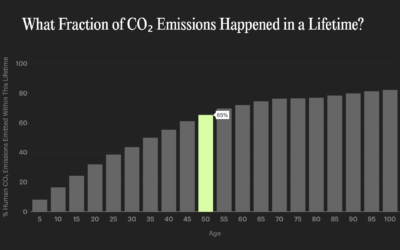
Interactive data essays on climate change
In their second issue, Parametric Press focuses on climate change with a set…
-
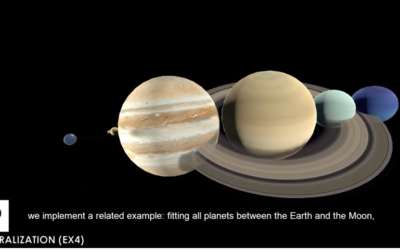
Data visualization in virtual reality
Virtual reality puts you in a digital world that can feel like a…
-
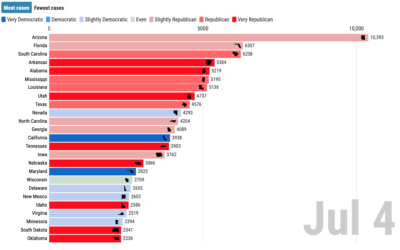
Covid-19 cases and state partisanship
From Dan Goodspeed, the bar chart race is back. The length of the…
-
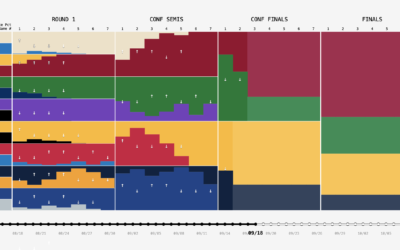
NBA playoff win probabilities, animated over time
FiveThirtyEight publishes win probabilities for NBA games throughout the season. During the playoffs,…
-
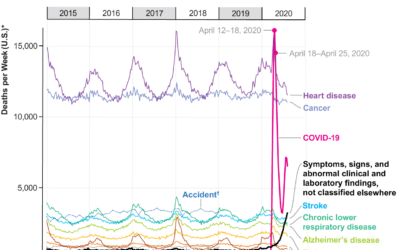
Covid-19, the third leading cause of death
For Scientific American, Youyou Zhou made a line chart that shows cause of…
-
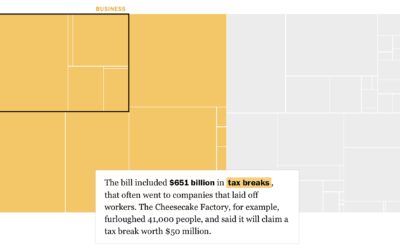
Breaking down the $4 trillion bailout
Using a straightforward treemap, The Washington Post looks at where the $4 trillion…
-
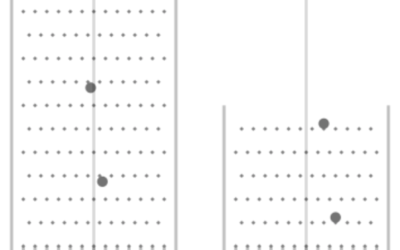
Presidential Plinko
To visualize uncertainty in election forecasts, Matthew Kay from Northwestern University used a…
-
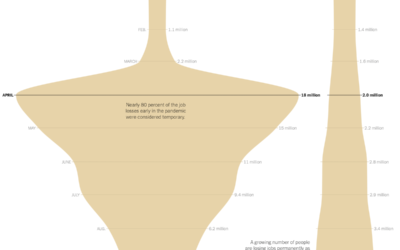
Shape of unemployment
For The New York Times, Ella Koeze looks at the various types of…
-
Millions of people experienced unhealthy air in 2020
NPR estimated how many people have experienced unhealthy air this year, largely in…
-
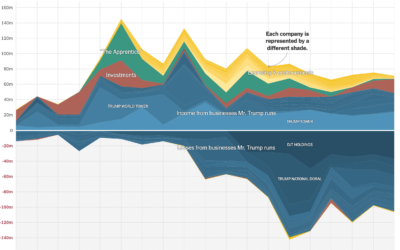
Timeline of the President’s taxes
The New York Times got a hold of the President’s tax records for…
-
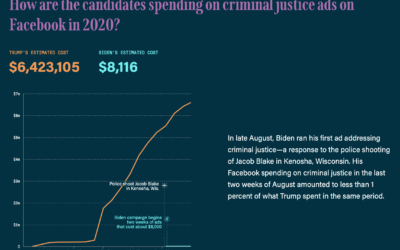
Trump’s criminal justice ad spending on Facebook
The Marshall Project contrasted ad spending on Facebook by Trump’s campaign against Joe…
-
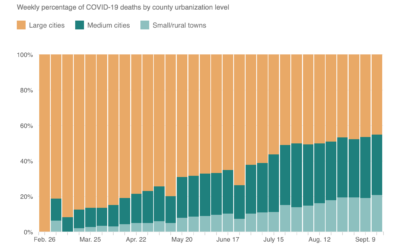
Shift of Covid-19 deaths to medium and small cities
When this all started, Covid-19 was impacting large cities at a much higher…


 Visualize This: The FlowingData Guide to Design, Visualization, and Statistics (2nd Edition)


