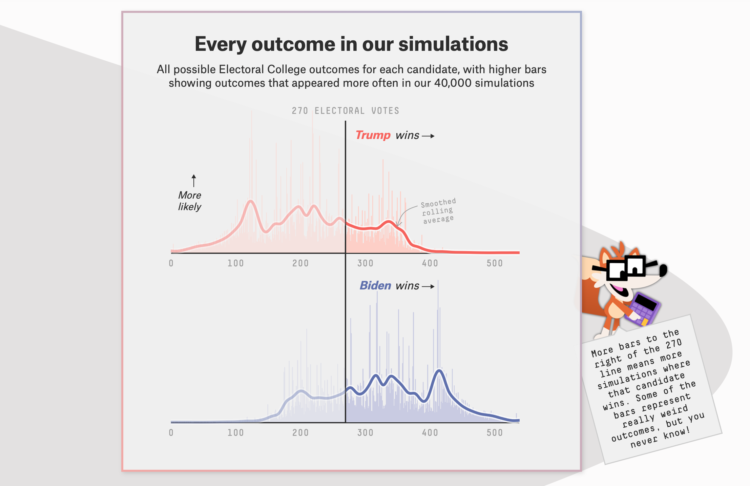
The election is coming. FiveThirtyEight just launched their forecast with a look at the numbers from several angles. Maps, histograms, beeswarms, and line charts, oh my. There is also a character named Fivey Fox, which is like Microsoft’s old Clippy providing hints and tips to interpret the results.
One thing you’ll notice, and I think newsrooms have been working towards this, there’s a lot of uncertainty built into the views. It’s clear there are multiple hypothetical outcomes and there’s minimal use of percentages, opting for fuzzier sounding odds.
Remember when election forecasting went the opposite direction? They tried to build more concrete conclusions than talking heads. Now pundits frequently talk about the numbers (maybe misinterpreted at times), and the forecasts focus on all possible outcomes instead of what’s most likely to happen.

 Visualize This: The FlowingData Guide to Design, Visualization, and Statistics (2nd Edition)