Projects
Graphics by Nathan Yau, borne out of everyday curiosities, learning experiments, and mild insomnia.
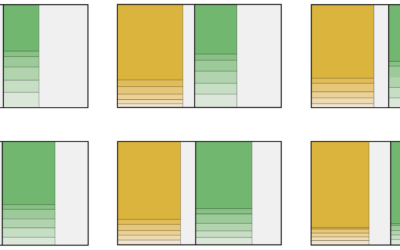
Who Takes Care of the Kids, By Household Income
Higher income usually means more childcare, and lower income usually means less.
Oldest, Youngest, and Middle Children, in Differently Sized U.S. Households
I looked at the percentages of people with a given number of kids in the family and the order they were born.
Change in Common Household Types in the U.S.
In the 1970s, the most common household type in the U.S. was a married couple with kids. Things are different now.
Trendiest Baby Name Every Year Since 1930, in the U.S.
Baby names gain sudden popularity for various reasons. See how it's changed over the years.
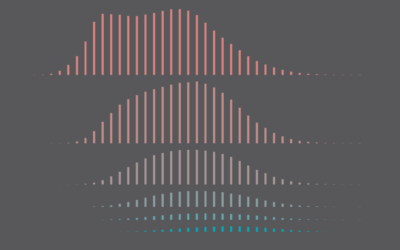
Age of Moms When Kids are Born
It's a wide range, based on data from the National Center for Health Statistics.
When There Were More Deaths Than Births in the U.S.
The two counts have been getting closer to each other. The past couple of years accelerated the process.
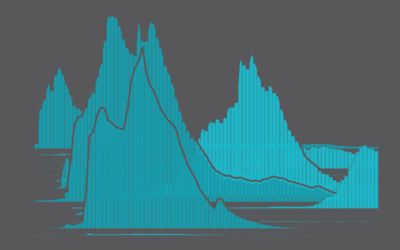
How Much Americans Make
Median income only tells you where the middle is. The distributions of income are a lot more interesting.
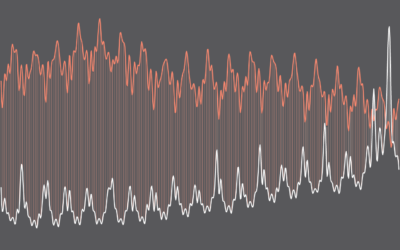
Declining U.S. Births
The number of births per month has been decreasing over the past decade. The pandemic seems to have sped up the process in the beginning.
What People Spend Most of Their Money On, By Income Group, Relatively Speaking
More money on average means bigger houses, more expensive cars, and fancier restaurants. But what if you look at relative spending instead of total dollars?
Most Common Daily Routines
We all have our routines, but from person-to-person, the daily schedule changes a lot depending on your responsibilities.
Television Genres Over Time
Here's how the distribution of genres has changed since 1945 up to present.
How the Longest Running Shows Rated Over Episodes
Most television shows don't get past the first season, but there are some that manage to stick around. These are the 175 longest running shows on IMDb that have ratings.
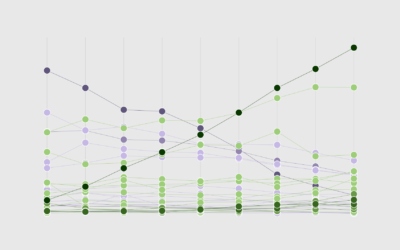
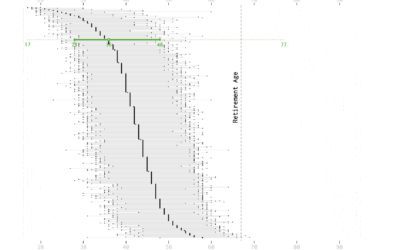
Age and Occupation
Whether it’s because of experience, physical ability, or education level, some jobs tend towards a certain age of worker more than others.


