Most Common Daily Routines
We all have our routines, but from person-to-person, the daily schedule changes a lot depending on your responsibilities.
If you work, company hours dictate much of your schedule. If you’re responsible for home operations, there’s a mix of housework, food preparation, and everything else that comes with keeping a home running smoothly.
On the other hand, if you’re retired, you’ve earned the time to relax and the flexibility to do what you want.
Using data from the 2020 American Time Use Survey, I charted these varying schedules. However, instead of looking at every activity throughout the day, I filtered the schedules down to the most common activities, given the time of day.
An example: On a weekday for women not in the labor force and no kids in the household, the most common activities at midnight are sleeping, relaxing, and grooming, in that order.
Try looking at the activities of an employed person with no kids on a weekday. The day seems so simple: work, eat, relax, and sleep. The flexibility of course allows younger folks to work more variable hours, which you can see in the second and third most common activities.
As you’d expect, increase the number of kids, and you see the non-work responsibilities add on.
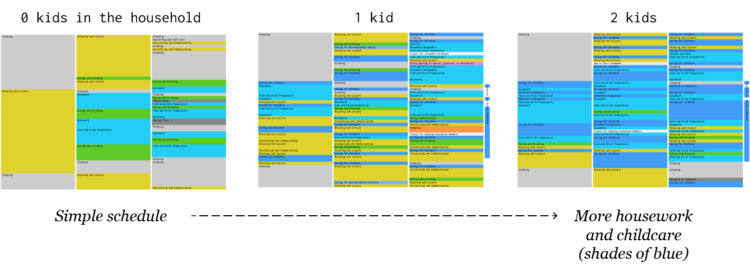
The snapshots above are for women. The changes are less dramatic for men.
As you increase the number of kids, keep an eye on the secondary childcare on the right, which indicates at least half of the population group taking care of kids in addition to a primary activity. Multitasking.
Switch over to the unemployed, and you see a more varied and unstructured day. Look at those not in the labor force with no kids in the household, and you’re mostly looking at the schedules of retired people and students.
Again, this is based on time use in 2020. I’m curious how this compares to previous non-Covid years.
Notes
- This is based on data from the American Time Use Survey for 2020, which did not run from mid-March to mid-May. I downloaded the data via IPUMS.
- I analyzed and prepared the data in R and Python. I made the chart above with D3.js.
Chart Type Used

Become a member. Support an independent site. Get extra visualization goodness.
See What You Get