Television Genres Over Time

IMDb catalogs television episodes with up to three genres. Here’s how the distribution of genres has changed since 1945, when there were only a few shows available, up to present day, when there are more shows any human could ever need.

Prints are available for a limited time in the FlowingData Shop.

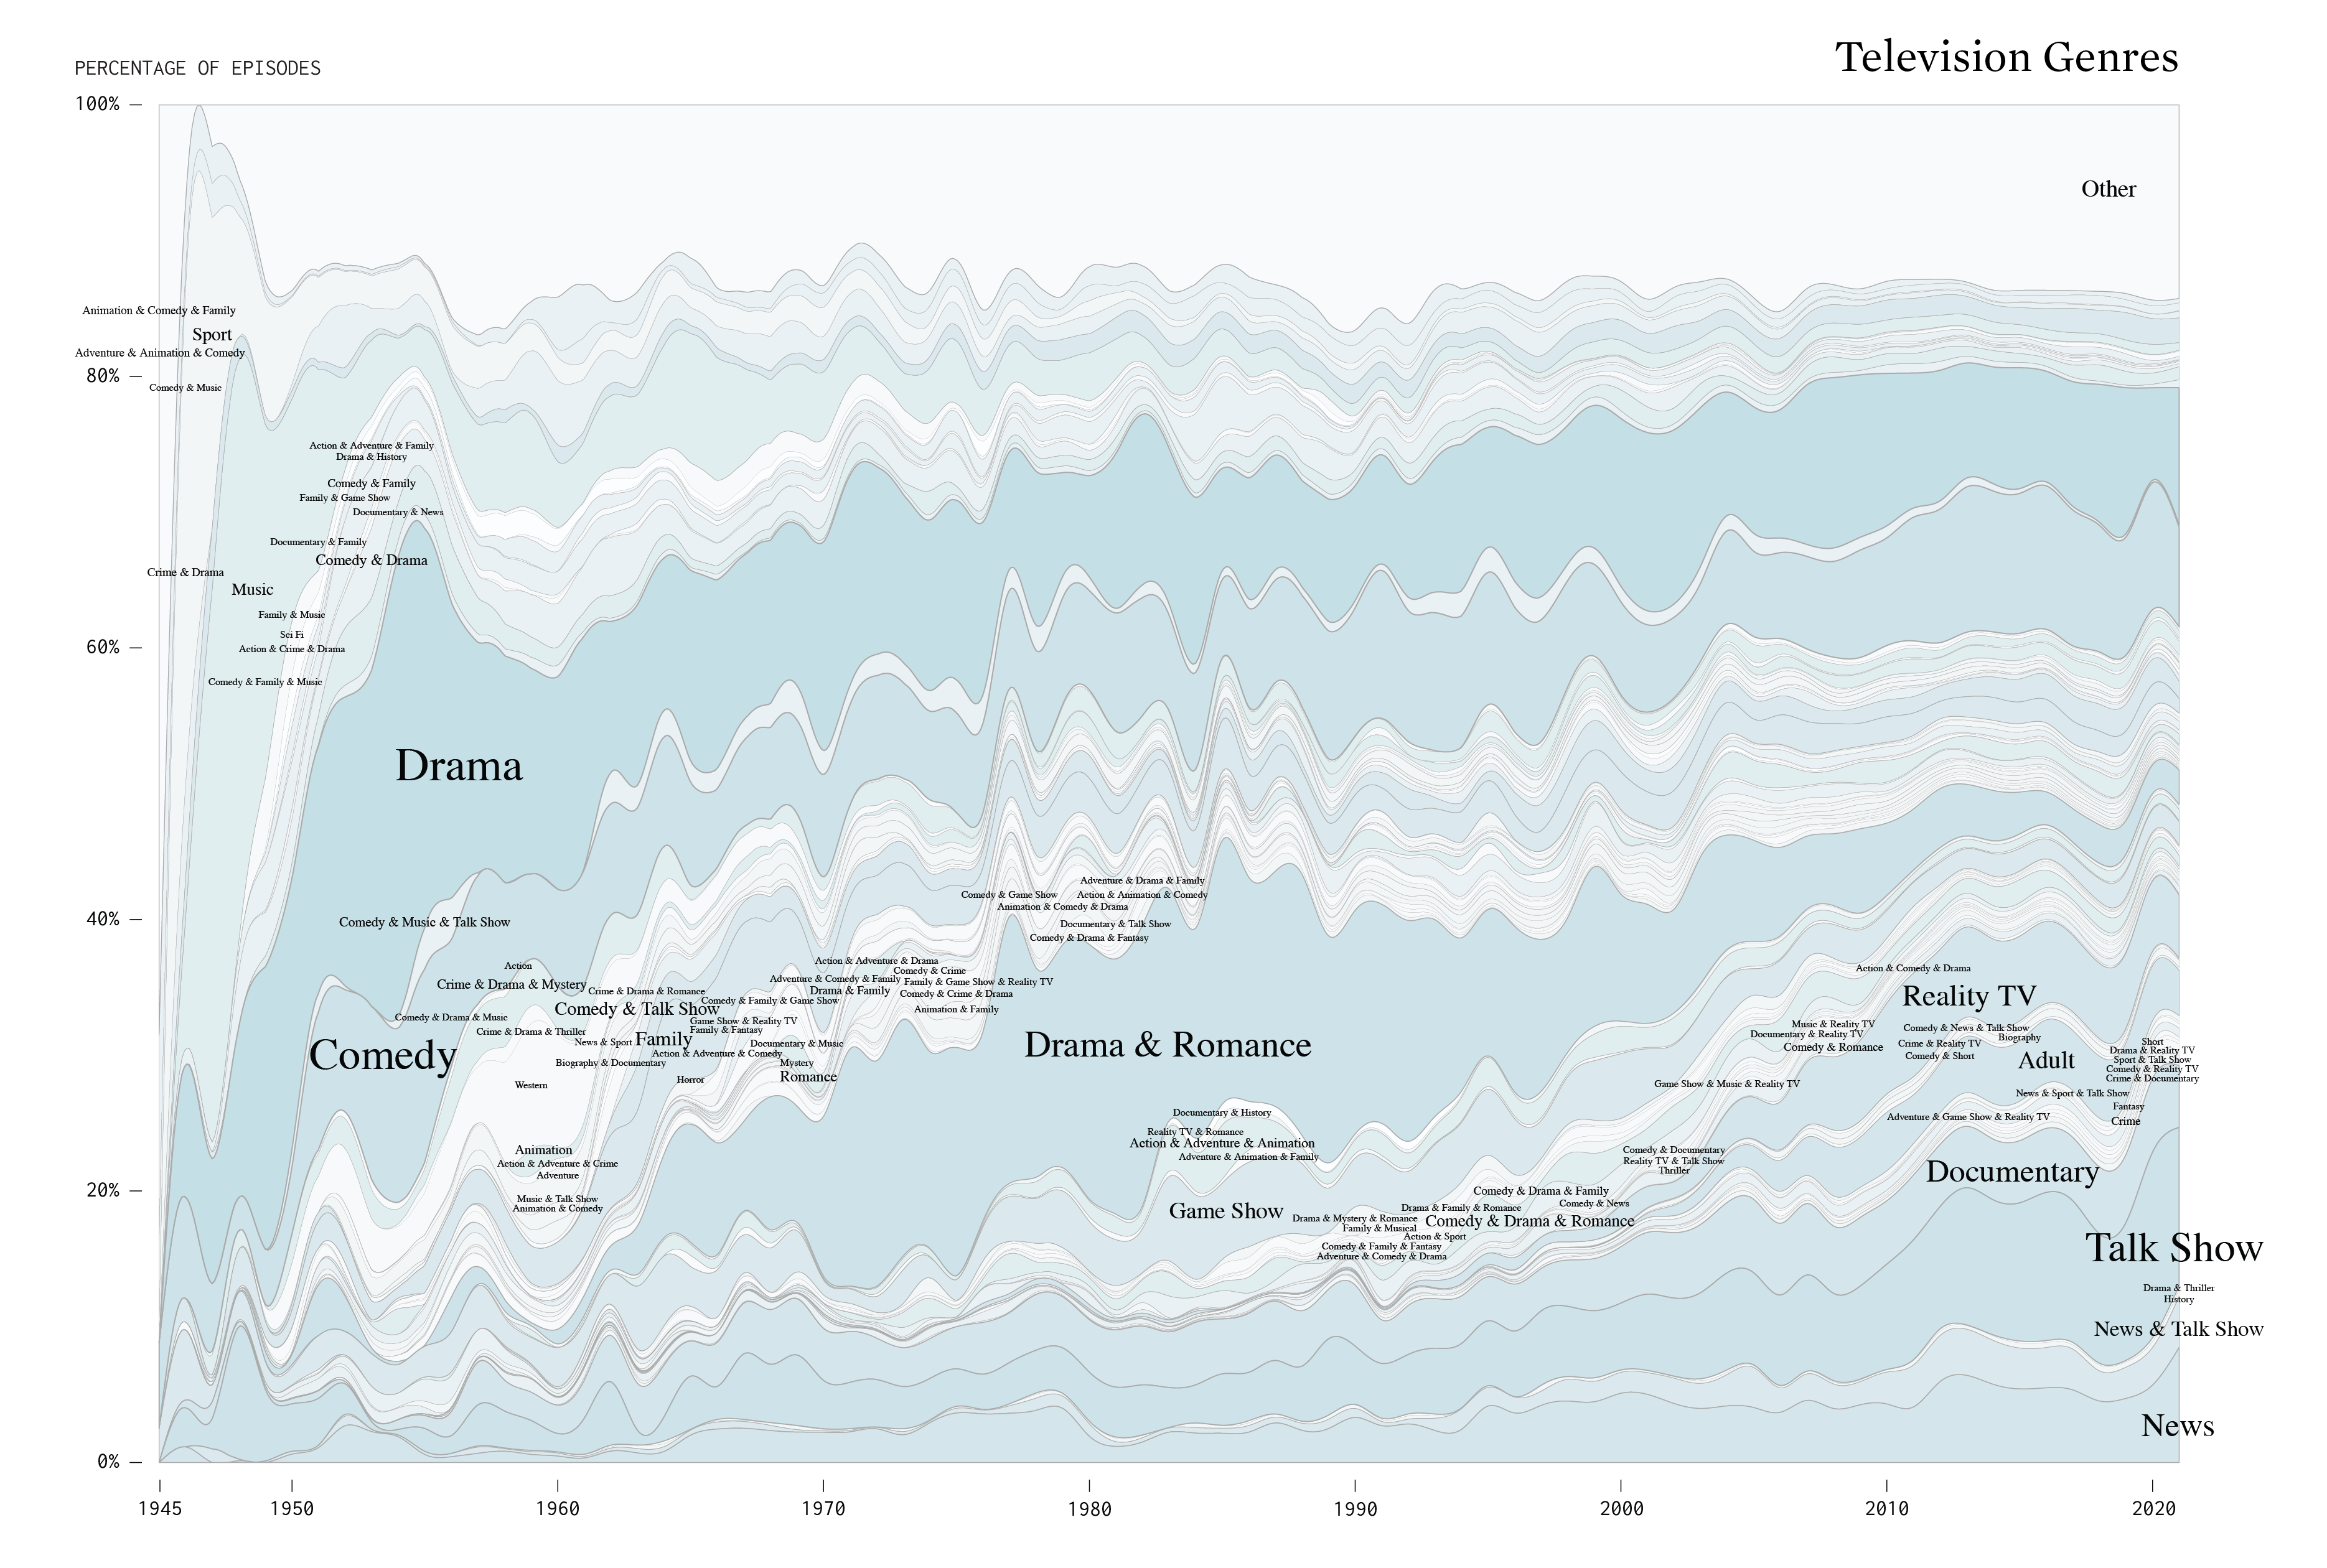
Comedy and drama (and combinations including them) still set the foundation, but reality TV, news, and talk shows make up a larger share than they used to.

Below are the individual genres split up, which makes it easier to see rising and falling patterns. Again, television episodes can have more than one genre, so the sum of the values below won’t sum to 100 percent.


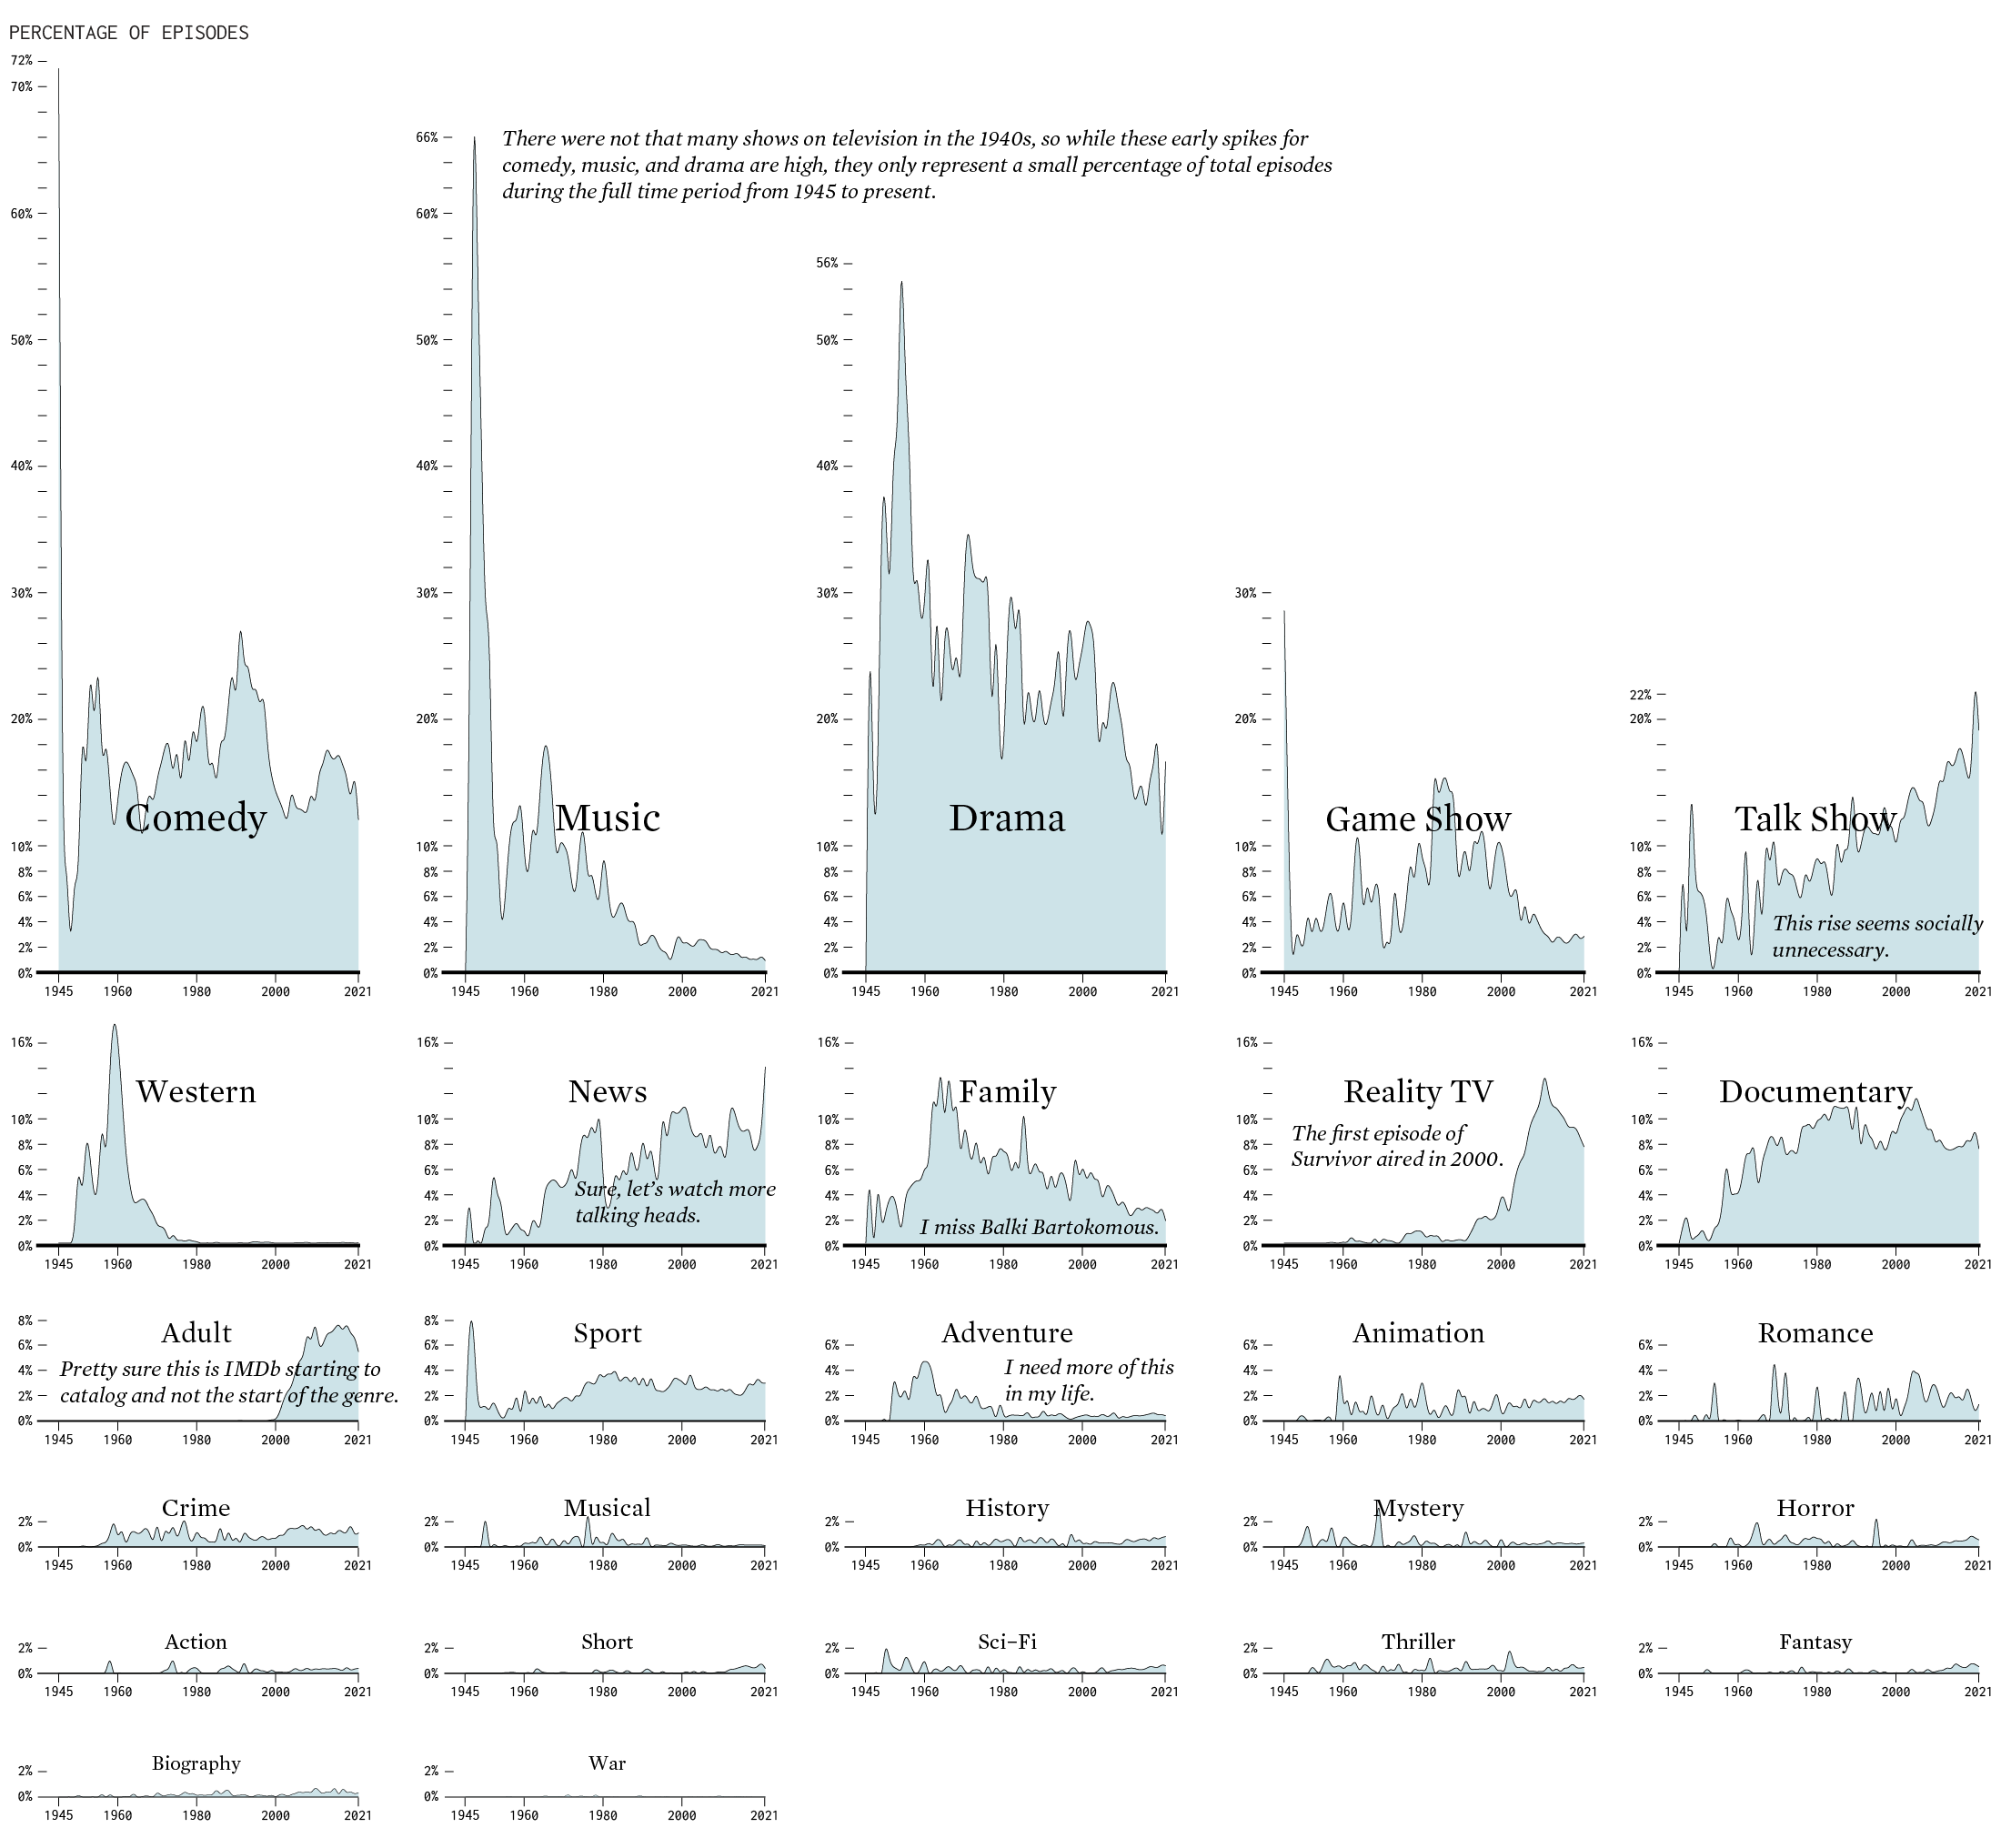
To be honest, I haven’t watched actual TV shows in years. I’m mostly a basketball and cooking videos type of a guy, but this seems about right? There sure are a lot news and talk shows. Maybe let westerns have another chance.

Become a member. Support an independent site. Make great charts.

See What You Get

Learn to Visualize Data See All →

How to Make Beeswarm Plots in R to Show Distributions

Try the more element-based approach instead of your traditional histogram or boxplot.

How to visualize data with cartoonish faces ala Chernoff

The goal of Chernoff faces is to show a bunch of variables at once via facial features like lips, eyes, and nose size. Most of the time there are better solutions, but the faces can be interesting to work with.

Introducing a Course for Mapping in R

Mapping geographic data in R can be tricky, because there …

How to Make Line Charts in Python, with Pandas and Matplotlib

The chart type can be used to show patterns over time and relationships between variables. This is a comprehensive introduction to making them using two common libraries.

Favorites

Unemployment in America, Mapped Over Time

Watch the regional changes across the country from 1990 to 2016.

All the Household Types in the U.S.

No need to restrict ourselves to the most common types. There are thousands. Let’s look at all of them.

How to Spot Visualization Lies

Many charts don’t tell the truth. This is a simple guide to spotting them.

How Much the Everyday Changes When You Have Kids

I compared time use for those with children under 18 against those without. Here’s where the minutes go.