Age of Moms When Kids are Born
People have kids at a wide range of ages, but the moments tend towards where we are in life. There are social norms and biological norms. Based on data from the National Center for Health Statistics, we can see how these ranges shift by child number.
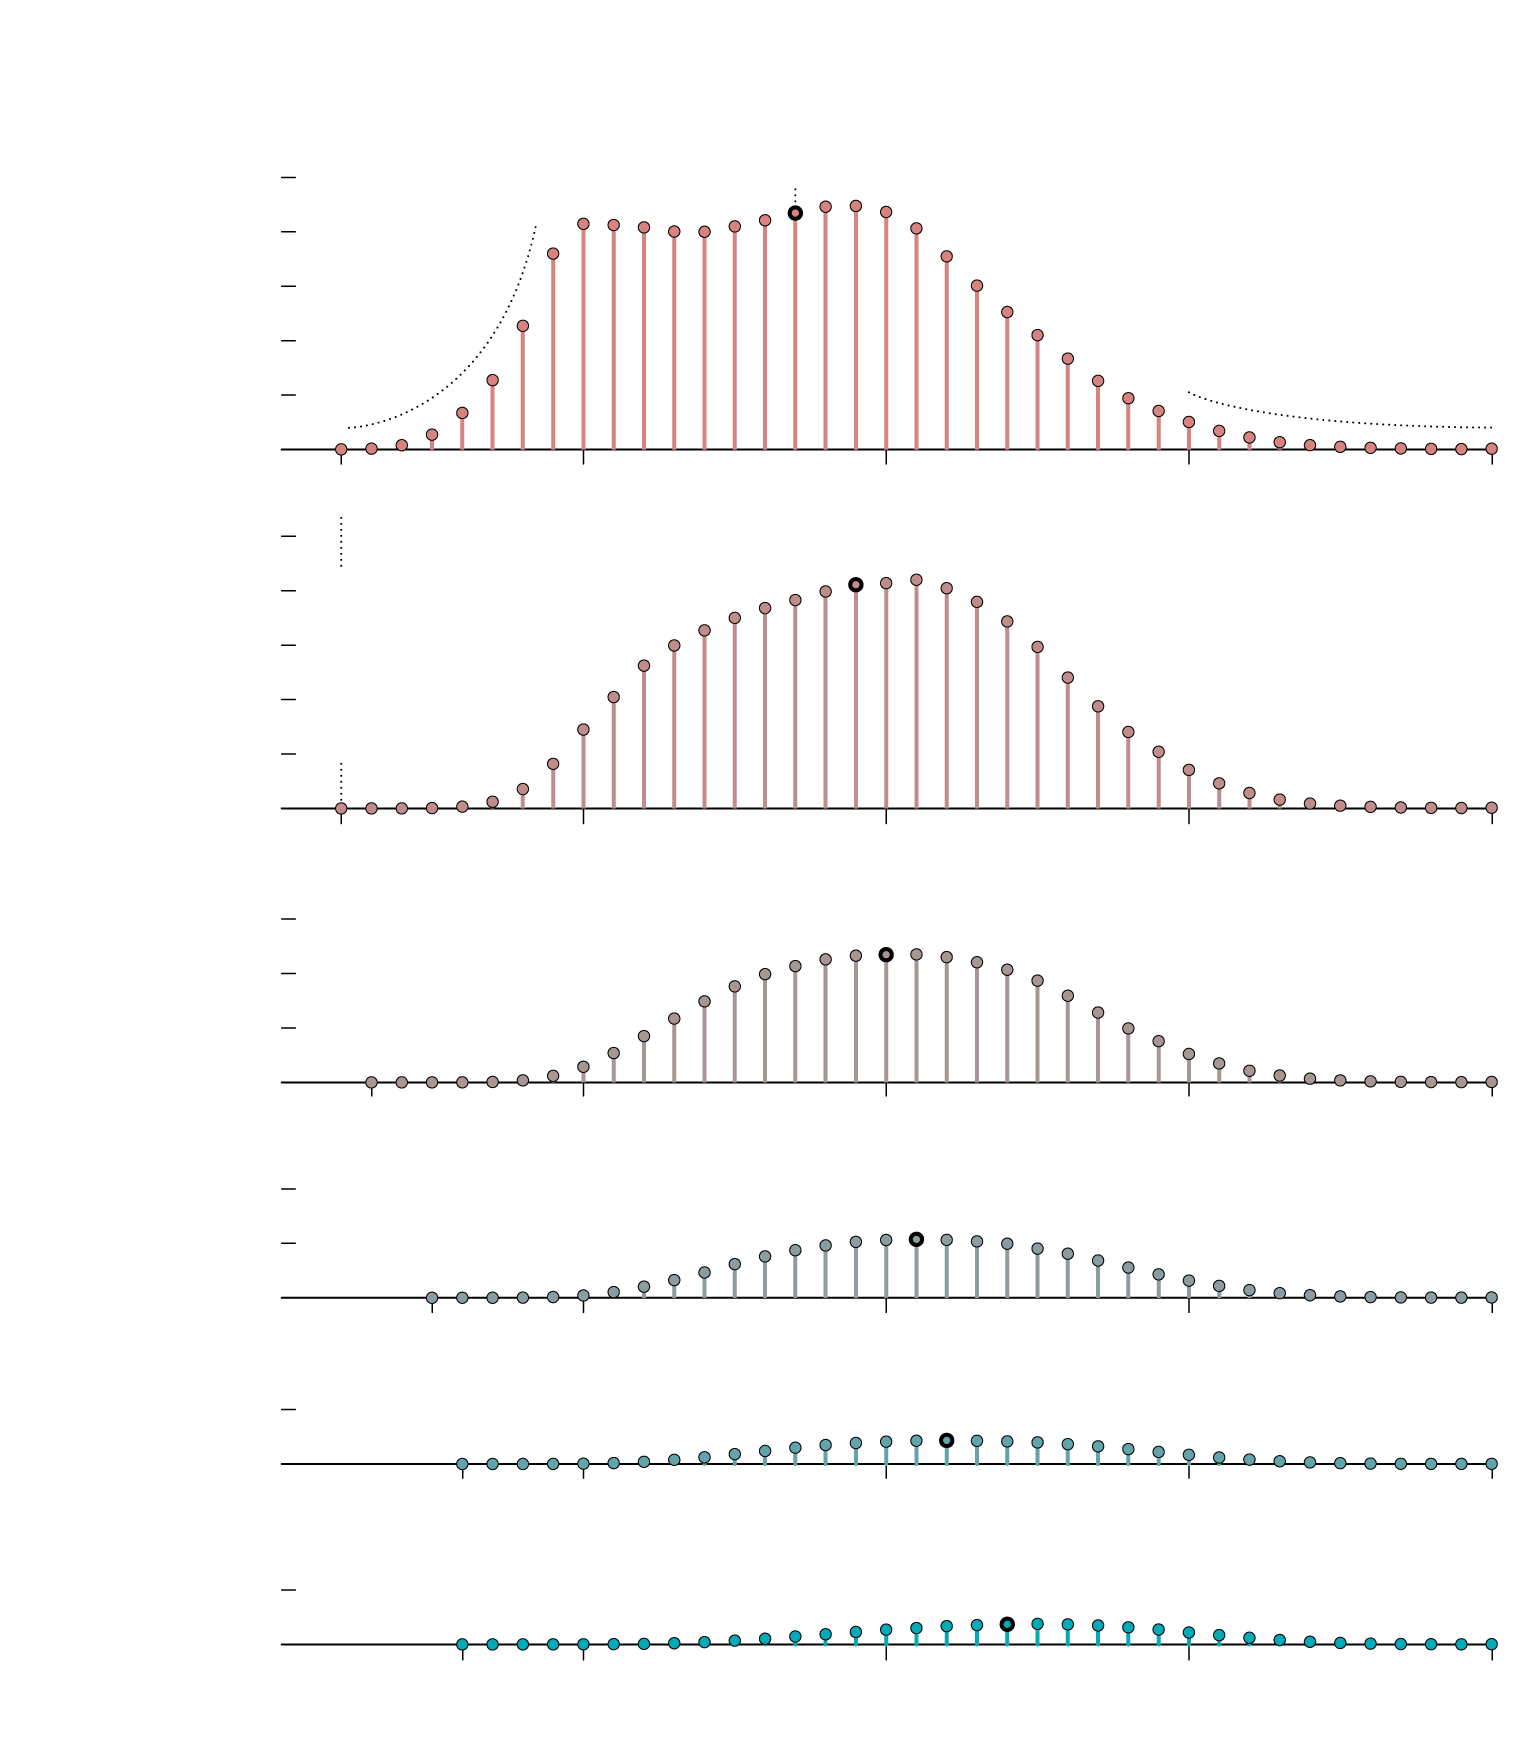
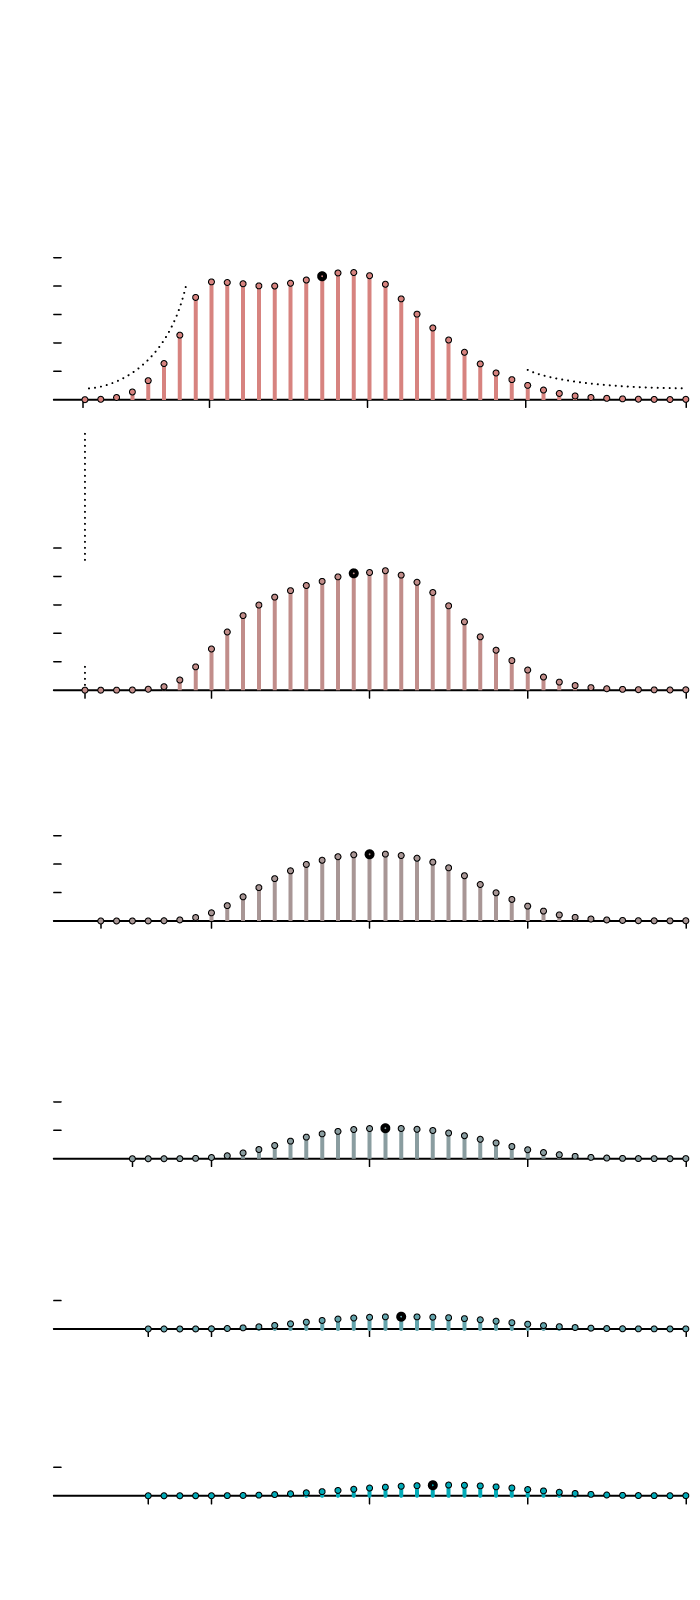
When Mothers Have Their Children in the U.S.
1st Child
BIRTHS FROM 2016-2020
MEDIAN
27 years
2.5%
2.0%
Having a first kid later in life is not as common but not unheard of.
1.5%
Teenage pregnancies
1.0%
0.5%
0.0%
12 YEARS OLD
20
30
40
50+
2nd Child
2.5%
29 years
2.0%
Sometimes babies are born to very young mothers.
1.5%
1.0%
0.5%
0.0%
12 YEARS OLD
20
30
40
50+
3rd Child
1.5%
30 years
1.0%
0.5%
0.0%
13 YEARS OLD
20
30
40
50+
More than three kids for one mother is growing less common.
4th Child
1.0%
31 years
0.5%
0.0%
15 YEARS
20
30
40
50+
5th Child
0.5%
32 years
0.0%
16 YEARS
20
30
40
50+
6th Child
or More
0.5%
34 years
0.0%
16 YEARS
20
30
40
50+
SOURCE: National Center for Health Statistics
When Mothers Have Their Children in the U.S.
1st Child
BIRTHS FROM 2016-2020
MEDIAN
27 years
2.5%
Having a first kid later in life is not as common but not unheard of.
2.0%
Teenage pregnancies
1.5%
1.0%
0.5%
0.0%
12 YEARS
20
30
40
50+
2nd Child
2.5%
29 years
2.0%
Sometimes babies are born to very young mothers.
1.5%
1.0%
0.5%
0.0%
12
20
30
40
50+
3rd Child
1.5%
30 years
1.0%
0.5%
0.0%
13
20
30
40
50+
4th Child
More than three kids for one mother is growing less common.
1.0%
31 years
0.5%
0.0%
15
20
30
40
50+
5th Child
0.5%
32 years
0.0%
16
20
30
40
50+
6th Child or More
0.5%
34 years
0.0%
16
20
30
40
50+
SOURCE: National Center for Health Statistics
Based on live births between 2016 and 2020, the median age of first-time moms was 27, and the median age of moms having more children gets older than that. That seems about right. But you can also see the medians are a small sliver of the whole.
Chart Type Used

Become a member. Support an independent site. Get extra visualization goodness.
See What You Get