Mozilla tech evangelist Paul Rouget has a go at Internet Explorer 9 in…
Infographics
Telling stories with data and graphics.
-
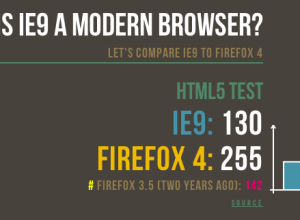
Firefox vs. IE: Is IE9 a modern browser?
-

Vintage literary stature graphic from 1906
Greg Ross highlights an old school graphic from The Strand Magazine, published in…
-

Most typical person in the world
Continuing their series on world population, National Geographic focuses in on the “most…
-
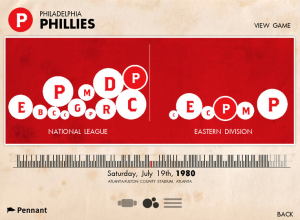
Every baseball game and play since 1951 on your iPad
If you love baseball and have an iPad, you need Pennant, a project…
-
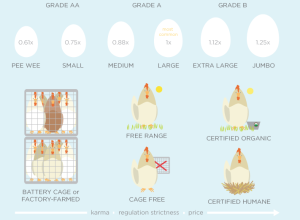
A visual guide to eggs
I can’t resist. It’s about food and those chickens are just so cute.…
-
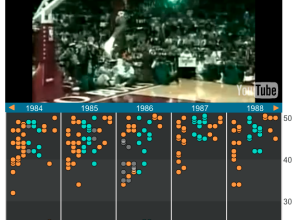
History of the dunk contest complete with videos
Here’s something to chew on while you wait for the 2011 slam dunk…
-
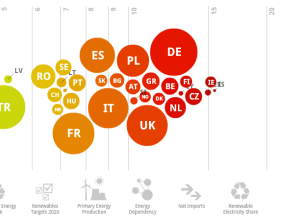
Europe’s energy targets in perspective
Designer Gregor Aisch has a look at energy usage in Europe. Click on…
-
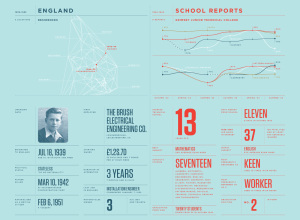
Annual Feltron report is up – this time with dad
I think we’ve all grown accustomed to this by now. Designer Nicholas Felton,…
-

Most viewed YouTube videos of all time iconified
Designer Ibraheem Youssef iconifies the most viewed YouTube videos of all time. Do…
-
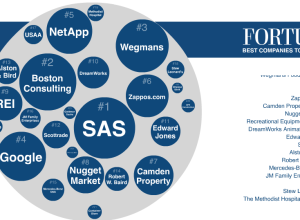
Best companies to work for and what employees say
Fortune Magazine recently published their annual list of top companies to work for,…
-
Bill Gates’ infographics section from annual letter
Even Bill Gates has an infographics section. In his 2011 annual letter, Gates…
-

A history of Coen brothers filmography
I post this graphic by Muller on the Coen brothers filmography mostly because,…
-
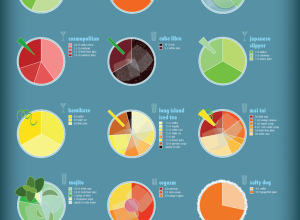
Charted guide to fancy drinks
I’m partial to all things food and drink related, so naturally my eyes…
-
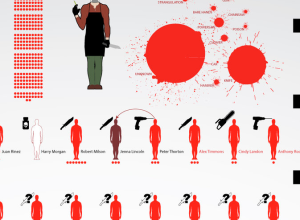
Dexter’s victims through season five
DeviantArt user dehahs, who seems to enjoy making graphics based on fiction (see…
-
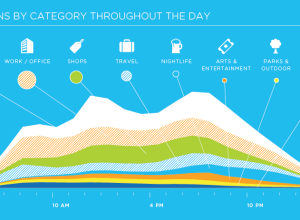
Growth and usage of foursquare in 2010
Foursquare has a look at their usage in 2010. I bet you were…
-
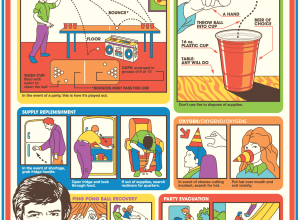
Flight safety-esque beer pong guide
It’s Friday. You might need this vintage-looking guide on how to play beer…
-
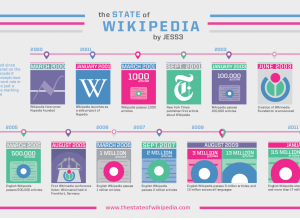
State of Wikipedia, 10 years later
In their most recent video (below) to their “State of…” series, JESS3 takes…
-
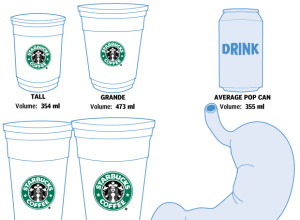
How Starbucks’ new Trenta compares to your stomach
Starbucks recently announced their next size up from 591-milliliter Venti: the Trenta. It’s…
Recently for Members
Second Edition
 Visualize This: The FlowingData Guide to Design, Visualization, and Statistics (2nd Edition)
 Visualize This: The FlowingData Guide to Design, Visualization, and Statistics (2nd Edition)
New tools, refined process.
Browse by Chart Type See All →


