North Drinkware molded Half Dome in the bottom of a hand-blown pint glass…
Data Art
Finding the beauty in numbers.
-

Elevation data molded in the base of a pint glass
-

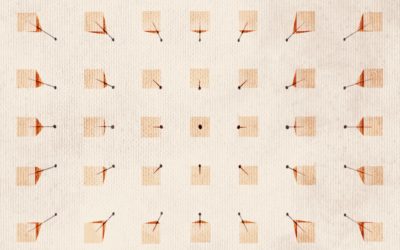
Disappearing animals as a matrix of dots
Reddit user WhiteCheeks used dot density to show population counts of various animals.…
-

Stock market mountains
After seeing stoxart, I was reminded of Michael Najjar’s project High Altitude from…
-
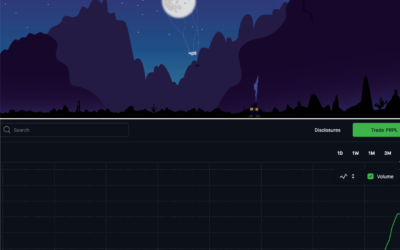
Stock market charts turned into illustrated landscapes
stoxart is a project by Gladys where she turns stock market charts to…
-
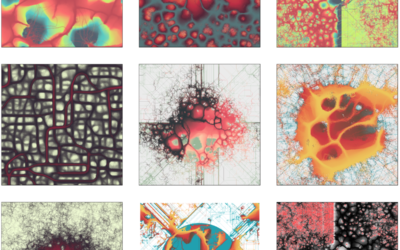
Using a slime mold simulation for generative art
Slime mold are single-celled organisms that can work together to form multicellular structures.…
-
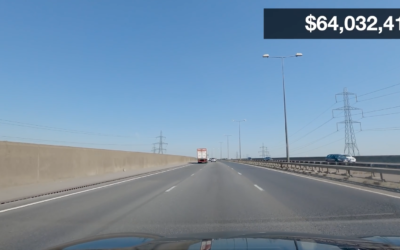
A million dollars vs. a billion visualized with a road trip
A million dollars. A billion dollars. The latter is 1,000 times more than…
-
Data visualization wallpaper
As a 100-day project, Alli Torban has been imagining what a data visualization…
-
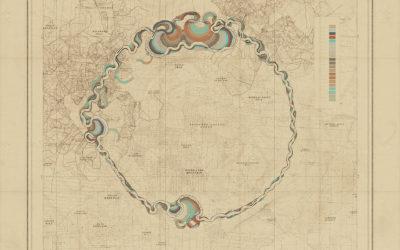
Meandering procedural river maps
Robert Hodgin built a procedural system he calls Meander to generate the beauty…
-
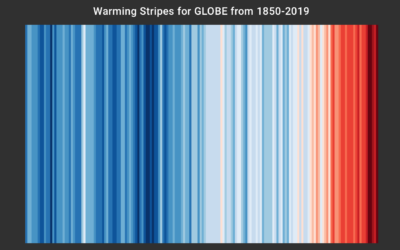
Global warming color stripes, as decorative conversation starter
Ed Hawkins, who you might recognize from charts such as spiraling global temperature…
-
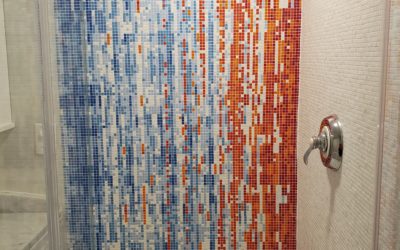
Climate change displayed, with shower tiles
Based on a chart by Ed Hawkins, the shower wall of Gretchen Goldman…
-

Social distancing demonstrated with balls and mousetraps
The Ohio Department of Health released this video to show the advantages of…
-

Now pull
A comic by Marcos Balfagón attaches action to the curve.…
-
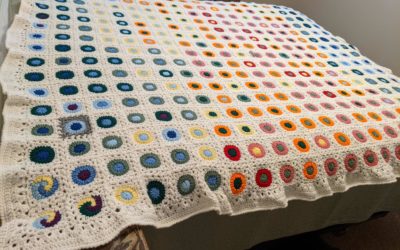
Blanket visualizes daily high and low temperatures
Reddit user quantum-kate used daily high and low temperatures in Denver in 1992…
-
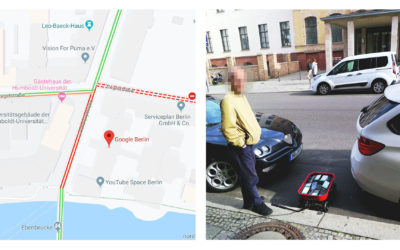
Faking traffic on Google Maps with a wagon of 99 smartphones
Google Maps incorporates data from smartphones to estimate traffic in any given location.…
-
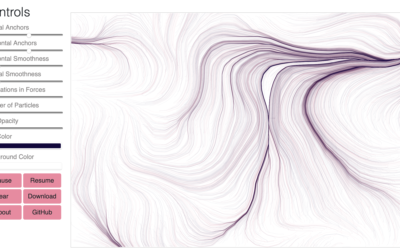
Flow Fields, a generative art tool
Flow Fields, a generative art tool by Michael Freeman, lets you adjust various…
-
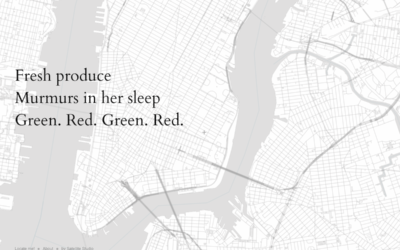
Haikus generated based on your map location and OpenStreetMap data
Satellite Studio made a map thing that generates haikus based on OpenStreetMap data…
-
Traveling Salesman art
Robert Bosch likes to use the Traveling Salesman Problem to draw famous portraits…
-

Photographs from above, an Overview
Overview is an ongoing project that uses a zoomed out view for a…
Recently for Members
Second Edition
 Visualize This: The FlowingData Guide to Design, Visualization, and Statistics (2nd Edition)
 Visualize This: The FlowingData Guide to Design, Visualization, and Statistics (2nd Edition)
New tools, refined process.
Browse by Chart Type See All →


