According to 2009 numbers reported by the Federal Bureau of Investigation, DC, Louisiana,…
Nathan Yau
-

States with the most and fewest firearms murders
-
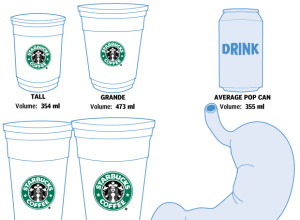
How Starbucks’ new Trenta compares to your stomach
Starbucks recently announced their next size up from 591-milliliter Venti: the Trenta. It’s…
-
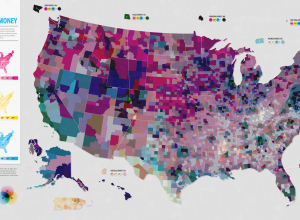
Open thread: Is this map too confusing?
This map, a collaboration between Good and Gregory Hubacek, shows three metrics from…
-

A guide for scraping data
Data is rarely in the format you want it. Dan Nguyen, for ProPublica,…
-

Size of the Universe
Because you can never get enough videos to remind you how tiny you…
-

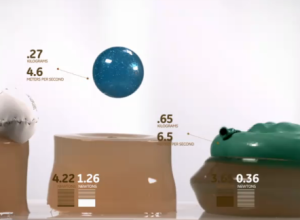
Falling in the fountain
Focus too hard on individual points, and ignore what’s around, and you too…
-
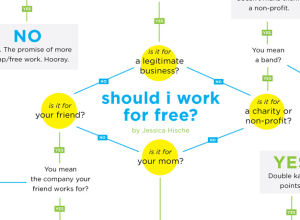
Flowchart: Should I work for free?
Designer Jessica Hische gets her flowchart on to help you decide whether you…
-

T-shirt life cycle
Nick Foster has some fun with t-shirt classification after cleaning out his closet:…
-
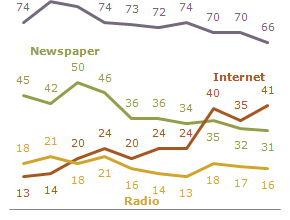
Visualize This: Where the public gets its news
According to polls from the Pew Research Center, the Internet gained on Television…
-
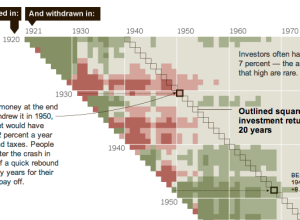
In investing, timing is everything
When you invest in stocks, it’s not just what you invest in, but…
-
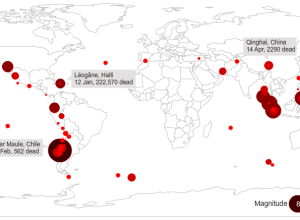
Haiti’s earthquake in context
Haiti’s earthquake in 2010 was by far the most devastating in a long…
-
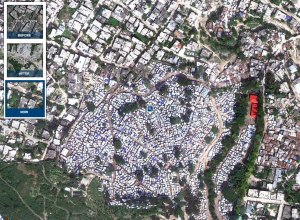
Aerial photos of destruction in Haiti, one year later
In memory of the devastating earthquake that hit Haiti one year ago on…
-
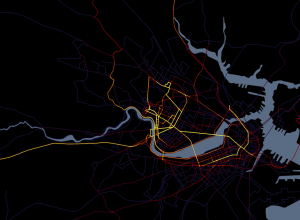
Mapping and documenting a year of travels
Cartographer Andy Woodruff documents all the places he goes, resulting in the pretty…
-
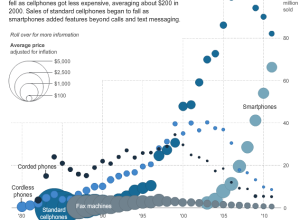
Price and adoption timeline of gadgets
New gadgets, from Web-connected TVs, to smartphones, to Fax machines, always seem to…
-

Visualizing deletion discussions on Wikipedia
Fact is not always clear cut. Sometimes fact is driven by opinion. People…
-
Football supporter map of London
Map of London colored by what team the majority supports. Not much of…
-
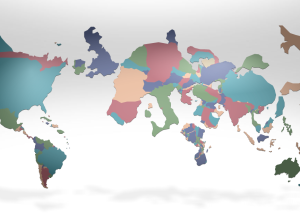
Our changing world in cartograms
In this series of interactive cartograms, FedEx shows our changing world (and I…
-
Physics of dynamic braking in slow motion
When you slow down your car, energy dissipates into the air as heat.…
-

Comment to win a copy of Data Analysis with Open Source Tools – winner announced
Looking to get more serious about your data analysis? Data Analysis with Open…
-

Data conference: only a few days left for early registration + reader discount
In case you haven’t heard, O’Reilly’s new Strata Conference on “making data work”…
Recently for Members
Second Edition
 Visualize This: The FlowingData Guide to Design, Visualization, and Statistics (2nd Edition)
 Visualize This: The FlowingData Guide to Design, Visualization, and Statistics (2nd Edition)
New tools, refined process.
Browse by Chart Type See All →


