Wikipedia’s annual fundraiser is in progress. If you haven’t noticed already, when you…
Nathan Yau
-
Visualize This: Winning Wikipedia fundraiser banners
-
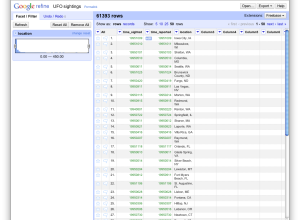
Format and clean your data with Google Refine
When we first learn how to deal with data in school, it’s nicely…
-
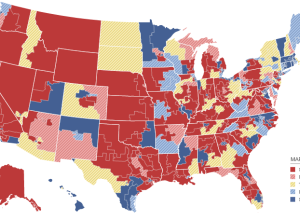
The very first NYT election map
Matthew Ericson, deputy graphics director of The New York Times, dug through the…
-
Learn the rules of data graphics so you can bend them
If you take away anything from The Visual Display of Quantitative Information, make…
-
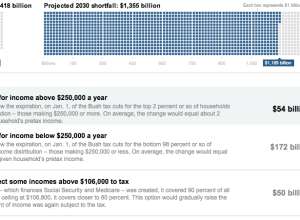
You fix the budget puzzle
Not pleased with how the government is handling the budget and deficit? Fine.…
-
Comparison of Republican and Democratic tax plans
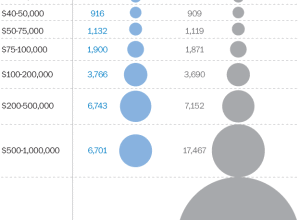
Lori Montgomery of the The Washington Post reports on the difference between the…
-
Algorithmic architecture with balls
Geometric Death Frequency-141 by Federico Diaz is an algorithm-based sculpture at MASS MoCA,…
-
Telling Stories with Data, A VisWeek 2010 Workshop
This is a guest post by Joan DiMicco, who heads the IBM Visual…
-
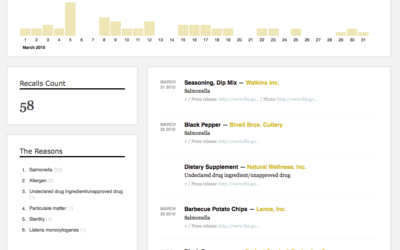
Making recalls and market withdrawals more accessible
Last week I found out that the FDA has a feed for all…
-
Mexican drug cartel network map
I’m not entirely sure what we’re looking at here, other than relationships between…
-
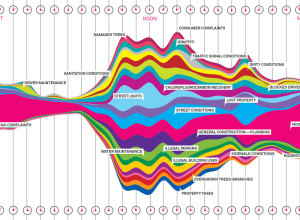
What New Yorkers complain about
Wired, in collaboration with Pitch Interactive, has a look at complaints called in…
-
Find the names in your data with Mr. People
Inspired by Shan Carter’s simple data converter, appropriately named Mr. Data Converter, Matthew…
-
Best of FlowingData – October 2010
Here are the most popular posts of October, according to combination of views…
-
Simple analysis makes Expedia extra $12m
There was a problem on Expedia where a lot of people were choosing…
-
Open thread: How do you start working on a data graphic?
People approach data in different ways, especially across different fields. When you’re presented…
-
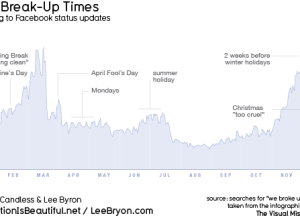
When people break up, according to Facebook updates
For his book The Visual Miscellaneum, David McCandless, along with Lee Byron, had…
-
Review: Atlas of Science, Visualizing What We Know
Katy Börner, professor of information science, catalogs visualization and science in Atlas of…
-
FlowingData is brought to you by…
My many thanks to the FlowingData sponsors. They help me keep the servers…
-
Keeping an eye on election results
All eyes here in the states will be on election results tonight, and…
-
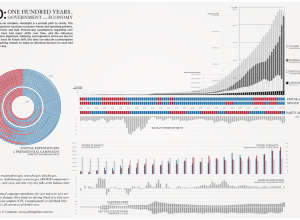
Past century of government and economy
John Palmer has a look at the past 100 years of government and…







 Visualize This: The FlowingData Guide to Design, Visualization, and Statistics (2nd Edition)


