Leading up to this year’s event, most of the talks from last year’s are up. This year’s speaker lineup looks even better. A must if you’re interested in visualization outside of analytics.
Nathan Yau
-
Link
Eyeo Festival talks →
-
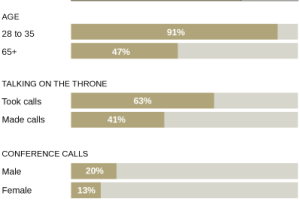
Texting on the toilet
I thought this riveting post on the New York Times Bits blog about…
-
Link
How Not To Sort By Average Rating →
Proper ranking, instead of just using raw values [via]
-
Link
Venn Diagrams →
What they are, when to use them and when not to
-
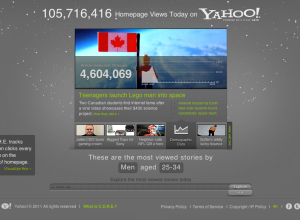
Visualizing popularity of Yahoo homepage stories
Yahoo is not what it used to be, but many parts of it…
-
Link
Munging, Modeling, and Visualizing Data with R →
Slides and some sample code for an intro to the software [via]
-
Link
Bloated Numbers →
Companies, especially tech ones, like to spout numbers, but when you actually look, the numbers are often meaningless. [via]
-
More people want to learn statistics
Data is hot right now, so as you would expect, more people are…
-
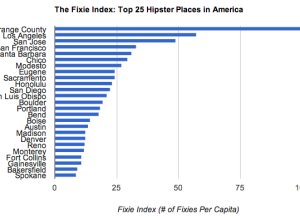
The Fixie Bike Index and hipsters
Priceonomics takes the association of fixie bikes to hipsters, and creates the Fixie…
-
Link
Displaying Data in the State of the Union →
Recap of the graphics used. The streaming enhanced version was struggling for me the other night, so I had to go with the non-chartified version.
-
Link
Unfolding →
Processing/Java library to create thematic maps and geovisualizations [via]
-
Own and securely store your location with OpenPaths
There are a lot of ways to collect your location, whether it’s for…
-
Link
Beginner’s Guide to Building a Map Server →
custom maps are all the rage these days
-
Link
Data Hub →
Another potential open data source, by CKAN
-
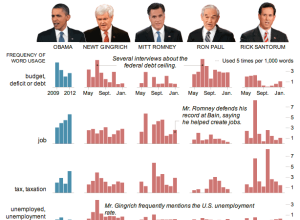
Words used in SOTU and Republican presidential candidates in debates
Jonathan Corum for The New York Times examines word usage by President Barack…
-
Link
When We Build →
When we build: “We shape our tools, and thereafter our tools shape us.” [via]
-

In perspective: One hour of video uploaded to YouTube per second
YouTube surpassed the one hour of video uploaded per second threshold recently. To…
-
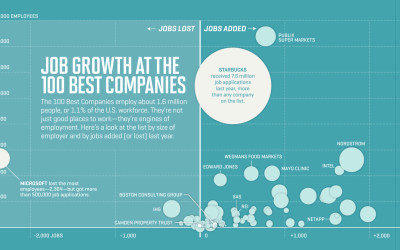
Job growth at the best companies to work for
Nicolas Rapp and Anne Vandermey with a straightforward look at new jobs added…
-
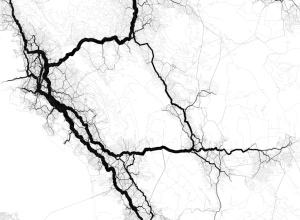
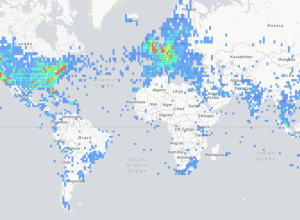
Geographic connectedness via Twitter locations
Eric Fischer has mastered the art of making use of geotagged things from…
-
Link
The “Mad Men” Years Are Giving Way to the “Math Men” Era →
“Advertising is based on one thing: Happiness.” [via]
Recently for Members
Second Edition
 Visualize This: The FlowingData Guide to Design, Visualization, and Statistics (2nd Edition)
 Visualize This: The FlowingData Guide to Design, Visualization, and Statistics (2nd Edition)
New tools, refined process.
Browse by Chart Type See All →


