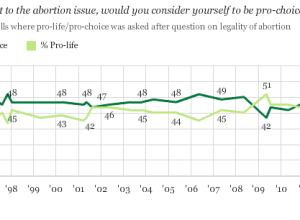
Winter Olympic events are filled with subtleties that if you know about them,…
Nathan Yau
-
Olympic event explainer videos
-
Disinformation visualization
Mushon Zer-Aviv offers up examples and guidance on lying with visualization.
We don’t… -
Texting data to save lives
Remember that TED talk from a couple of years ago on texting patterns…
-
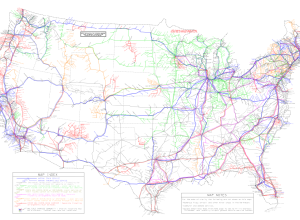
Map: US bus and Amtrak routes
In case you’re wondering how to travel the country without a car (in…
-

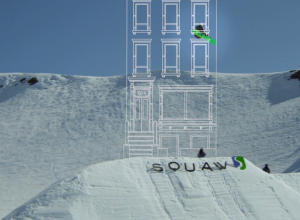
Olympic events placed in New York for scale →
The New York Times published a fun piece that places Winter Olympic events…
-

Where People Run in Major Cities
There are many exercise apps that allow you to keep track of your…
-
Quotes poster updates
For those who ordered a famous quotes poster: I’ll be updating the printing…
-
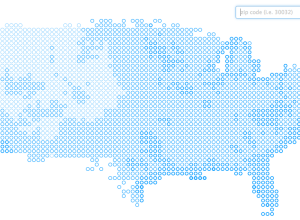
Places in the US with the most pleasant days per year
We’ve seen plenty of maps the past few weeks that show how bad…
-
Digitally revamped atlas of historical geography, from 1932
In 1932, Charles O. Paullin and John K. Wright published Atlas of the…
-
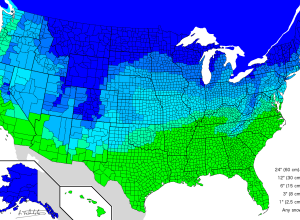
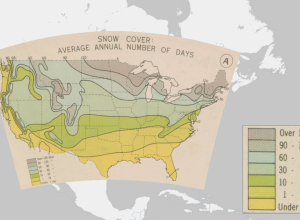
Amount of snow to cancel school
Someone ended an email to me last week with “Stay warm.” Not to…
-
How R came to be
Statistician John Chambers, the creator of S and a core member of R,…
-
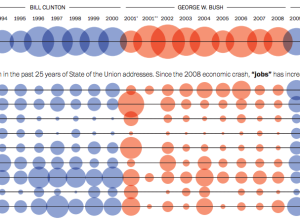
History through the president’s words →
The Washington Post visualized the use of specific words throughout the years during…
-
Last day to pre-order quotes poster
It’s been an interesting few days. I thought a few people would find…
-
Learn R interactively with the swirl package
R, the statistical computing language of choice and what I use the most,…
-
What a computer sees while watching movies
Benjamin Grosser visualized how computers “watch” movies through vision algorithms and artificial intelligence…
-
Members Only

How to Map Geographic Paths in R
As people and things move through a place, it can be useful to see their connected paths instead of just individual points.
-
FlowingData Job Board, January 2014
Looking for a job in data science, visualization, or statistics? There are openings…
-
Public transit times in major cities
Last year, WNYC made an interactive map that shows transit times in New…
-
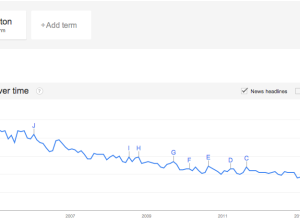
Facebook debunks Princeton study
Researchers at Princeton released a study that said that Facebook was on the…
-

Bird flight paths
Dennis Hlynsky, an artist and a professor at the Rhode Island School of…
Recently for Members
Second Edition
 Visualize This: The FlowingData Guide to Design, Visualization, and Statistics (2nd Edition)
 Visualize This: The FlowingData Guide to Design, Visualization, and Statistics (2nd Edition)
New tools, refined process.
Browse by Chart Type See All →


