In the latest SIAM Journal on Applied Mathematics, Chaturapruek, et al. describe modeling…
Nathan Yau
-
Tracking criminal movements and predicting hot spots
-
Link
7 command-line tools for data science
A quick list of command-line tools to putz around with data.
-

Acetaminophen availability around the world
Probublica has a detailed piece on the potential overuse of acetaminophen, commonly known…
-
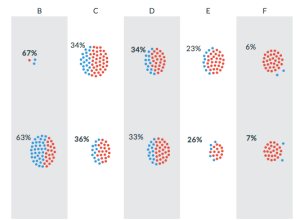
A visual explanation of Simpson’s Paradox
When you look for overall trends, you often poke around the data in…
-
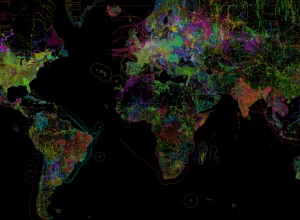
OpenStreetMap, the work of individuals visualized
In the continued series of meta-data-driven maps, OpenStreetMap shows the work of individuals…
-
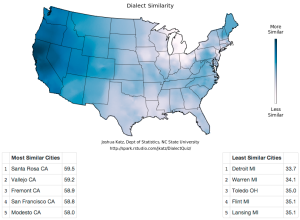
Dialect quiz shows where others talk like you do
North Carolina State statistics graduate student Joshua Katz already mapped dialect across the…
-
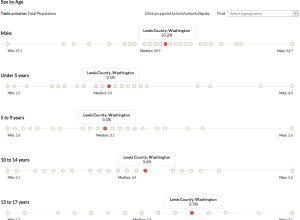
Easier Census data browsing with CensusReporter
Census data can be interesting and super informative, but getting the data out…
-
New data jobs this month
It’s been just under a month since the Job Board went up, and…
-
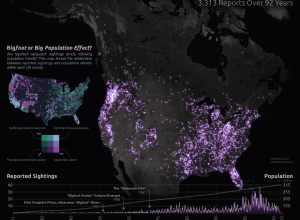
Sasquatch sightings
Josh Stevens, a PhD candidate at Penn State, mapped 92 years of sasquatch…
-

D.C. building heights study
Emily Chow and Gene Thorp for The Washington Post explored the change in…
-

Excel paintings
Tatsuo Horiuchi wanted to learn something new before retiring, so he bought a…
-
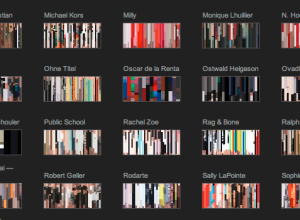
Fashion fingerprints →
In a collaborative effort at The New York Times, a Fashion Week browser…
-
How you know you’re in an upscale neighborhood
By way of reddit, analog traces, or as they’re more commonly known: dirt.…
-
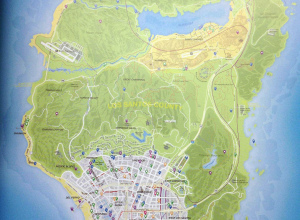
Game map from Grand Theft Auto 5
With just five days left until Grand Theft Auto 5 is out, a…
-
Members Only
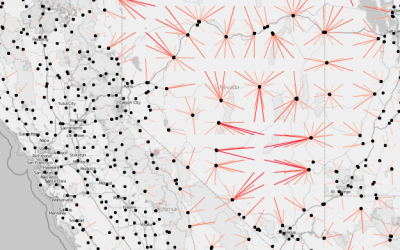
Working with Line Maps, the Google Places API, and R
A frequent challenge of visualization is behind the scenes, to get the data and to mold it into the format you need. Do that. Then map.
-
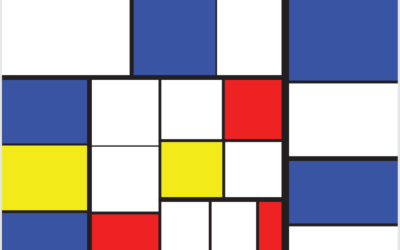
Treemap art
Ben Shneiderman invented the treemap in the 1990s to visualize the hierarchical contents…
-
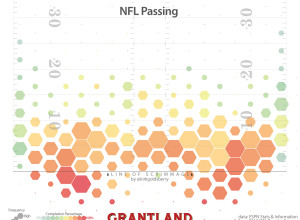
Where NFL quarterbacks throw
Kirk Goldsberry, known for his basketball analysis and shot charts, has applied his…
-
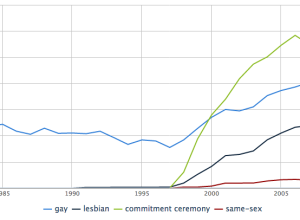
Crunching the wedding numbers
Weddings are special events where friends and family come together to celebrate, and…
-
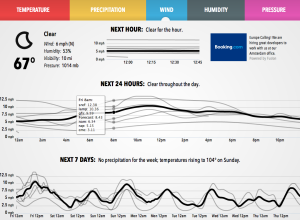
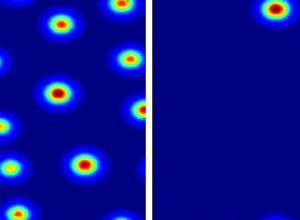
Weather models, a visual comparison
Forecast, one of the best if not the best quick-look weather sites, uses…
-
UK Census at risk
There is a possibility the UK Census is scrapped for cheaper options next…
Recently for Members
Second Edition
 Visualize This: The FlowingData Guide to Design, Visualization, and Statistics (2nd Edition)
 Visualize This: The FlowingData Guide to Design, Visualization, and Statistics (2nd Edition)
New tools, refined process.
Browse by Chart Type See All →


