Names are incredibly personal things. It’s how we identity ourselves. We associate others, places, and points in our past with names. Maybe you recall a family member, a celebrity, or a significant other.
At the same time, it’s not uncommon for two people with the same name to run into each other, and it’s why gift shops can sell and profit from those mini license plates. Parents decide what they want to call their kid at some point. So as you walk through history, you end up with names that surge, some that die off, and some that come back again.
Hilary Parker already looked at the most poisoned name in US history (her own). Here we look at names from the other direction. The most trendy:
The Social Security Administration provides name data (in a surprisingly easy-to-use file format) that goes back to 1880 through 2012. The data includes the number of babies filed under a certain name for each year. Names with fewer than five babies in a year are not included for privacy reasons.
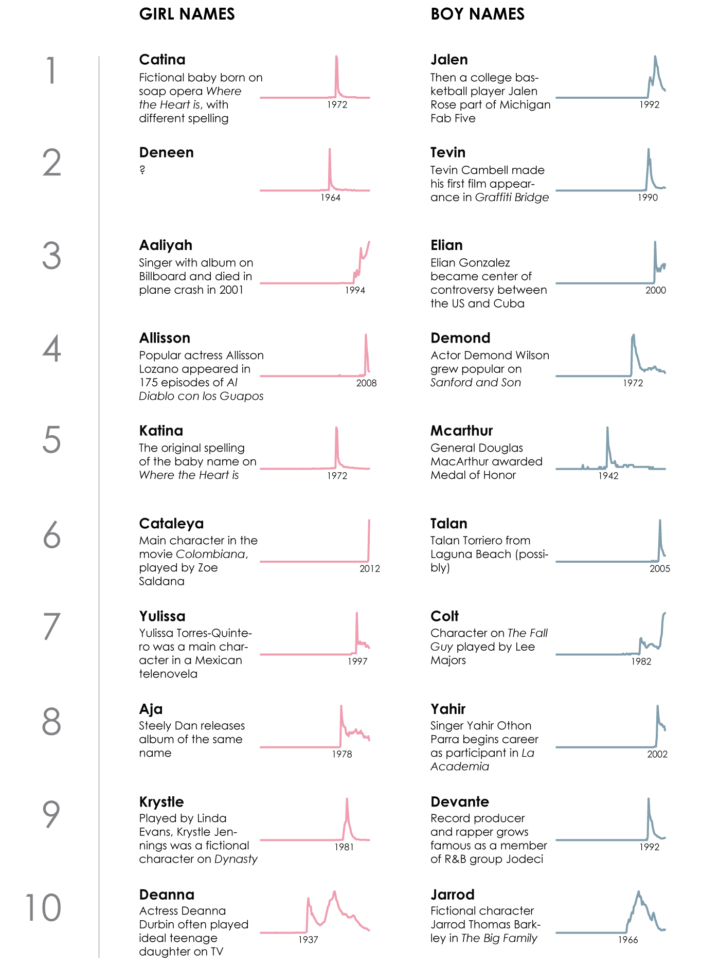
Hilary used relative risk to find names that plummeted, and I basically did the same, but looked for gains instead of losses. If a small percentage of the baby population was given a name one year and a relatively much higher percentage of the next year’s baby population got said name, we consider that a trendy name. No interest to a bunch of interest. The list above shows the top 10 girl and boy names with the biggest relative risk spikes.
The most interesting bits are the historical associations with each spike. You have soap operas, music videos, political controversy, and celebrities.
I couldn’t figure out where Deneen in 1964 came from though. Hilary identified the name as also one of the most poisoned names in history and attributed the trend to one-hit wonder group August & Deneen, but their song came four years later in 1968. So if anyone knows, please send me a note.
Here are the top 20-ish trendy girl names with the ones with the highest percentages highlighted.
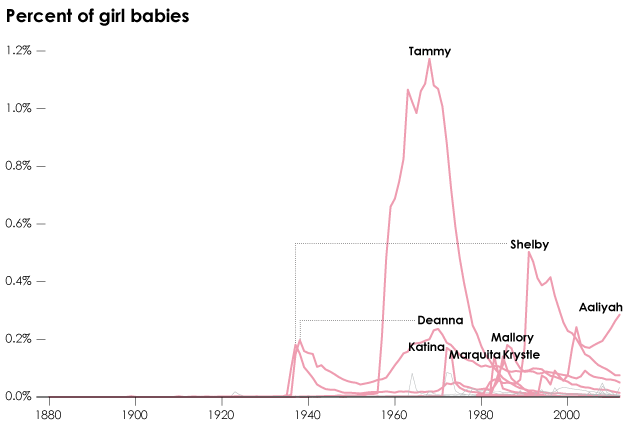
As you move out of the top 10 trendy names, there are some interesting points. For example, Tammy, which was number twenty on the girls list, spiked in 1957, but the name just kept on going through the early 1970s. The film Tammy and the Bachelor, along with its title song Tammy that was Academy Award-nominated for Best Original Song, jumpstarted the name. It reached its peak in 1970 with a #8 overall rank for girl names.
Two other data points: Shelby and Deanna spiked in the late 1930s, but then each hit their peaks a few decades later.
Notice that a lot of these trendy names are happening in later decades. I’ll get to that in a second.
First though, here’s the same view as above for boy names.
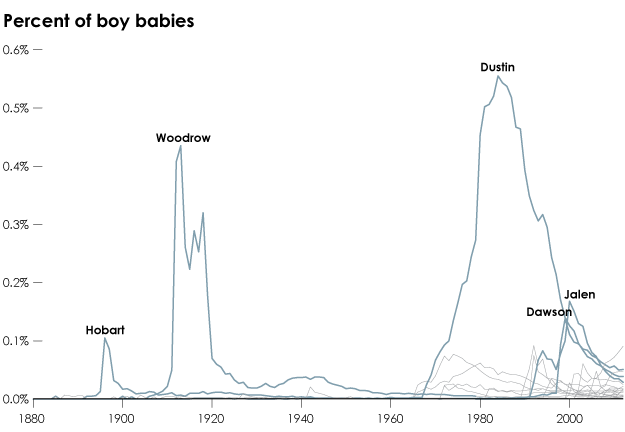
Boy name trends tended to be less volatile and a lot lower in percentages relative to girl names. Other than Jalen, the names highlighted above didn’t make the top 10, but saw some spikes. Hobart for Garret Hobart. He became the vice president of the United States in 1897. Woodrow for Woodrow Wilson, the 28th president of the United States. Then there was Dustin from Dustin Hoffman who starred in The Graduate in 1967. Dawson: It spiked the year Dawson’s Creek started. (Go figure.) Jalen spiked twice.
Again, notice the greater number of trendy spikes, most of them not highlighted, in more recent years. The pattern seems to be headed towards more unique names per population. For example, the most popular girl name in 1920 was Mary with 5.7% of the baby girl population. In contrast, the most popular girl name in 2012, Sophia, topped the list with only 1.2%.
An easy way to see the changes in name diversity over the years would be to look at the number of names per population, but like I said earlier, the SSA doesn’t show names with fewer than five people in a year for privacy reasons. However, if we look at the number of listed babies per name we can see a decline — more names per baby population — starting in the 1960s.
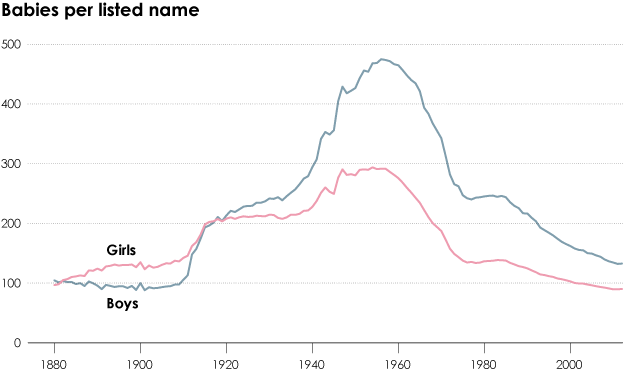
And although we can’t see how many names aren’t listed, we can see what percentage of babies had names each year that the SSA doesn’t show. We just take the difference between total annual applications and the total listed.
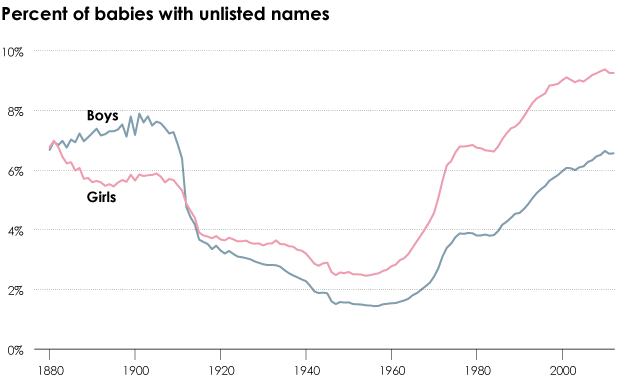
Keep in mind that the United States didn’t issue Social Security numbers until the end of 1935, so the data before then is retroactive. That is, the name data pre-1935 is based on people who were alive in 1935. This is most obvious when you look at total counts in 1935, and then move back in time. You can see the difference between male and female counts increase the further back you go, which makes sense because women tend to live longer than men. This might explain the boy-girl flip and the name rates in the early 1900s might be different from what the data shows.
In any case, the trend of uniqueness for the past few decades is clear. Just imagine if the trend continues for a few decades. It’ll be crazy easy to stalk people on Google. Maybe I should give my future kids the most common names possible.
I could go on for a long time with this data, but I’ll stop here. To end, just for kicks, the most popular names by quarter century:
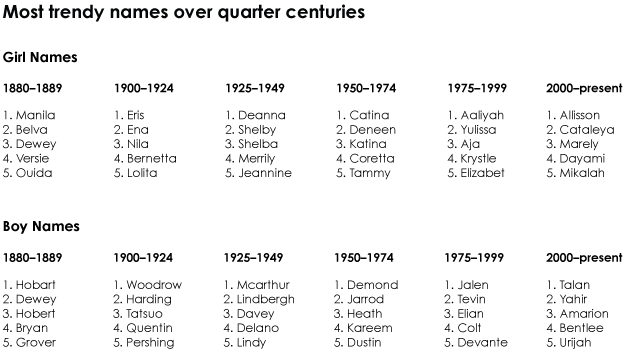
I’ll leave it you to figure out the significances.
 Visualize This: The FlowingData Guide to Design, Visualization, and Statistics (2nd Edition)