There were a couple of similar quantified self articles last week about email.…
Nathan Yau
-
Quantified email
-
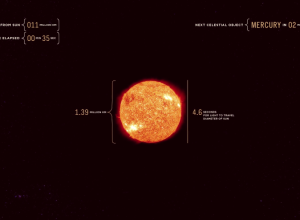
Really slow speed of light
The “speed of light” typically means “really fast” but when it’s relative to…
-
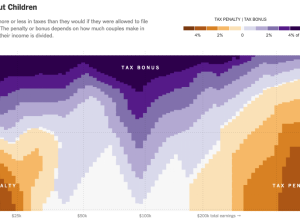
Married couple tax bonuses and penalties
Using calculations by Nick Kasprak from the Center on Budget and Policy Priorities…
-
Members Only
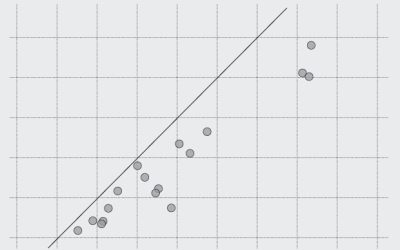
How to Make Dot Plots in R
It’s easy to draw dots. The challenge is to make them meaningful and readable.
-

Why study statistics
In their continued efforts to present statistics as a field that doesn’t suck,…
-

LEGO explainer: Taxes and income inequality
LEGOs make everything better. David Wessel for Brookings Institution explains how federal taxes…
-
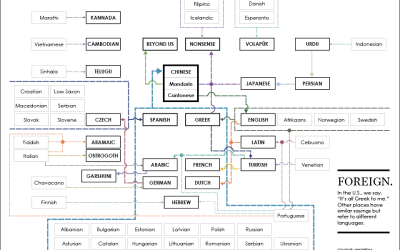
It’s All Greek (or Chinese or Spanish or…) to Me
In English, there’s an idiom that notes confusion: “It’s all Greek to me.” Other languages have similar sayings, but they don’t use Greek as their point of confusion.
-
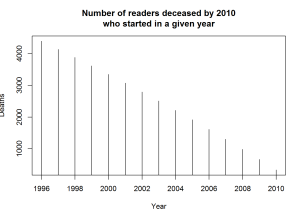
Estimated number of Game of Thrones readers who have died
We know there are a lot of deaths in Game of Thrones, but…
-

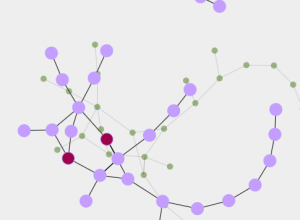
Asteroid database
Asterank is an asteroid database maintained by Ian Webster, an engineer at Google.…
-

A tall graphic to show Mt. Everest scale
Mt. Everest is a tall mountain. How tall is it?? Glad you asked.…
-
Link
More on Gestalt principles for visualization →
-
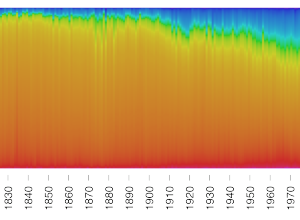
Color use in paintings, by year
Martin Bellander saw some projects that extracted color from movie posters and trailers,…
-

Cocktail construction chart
Remember that engineer’s guide to drinks a while back? I think this one…
-

Dick pics, privacy, and the NSA
Did you watch the latest Last Week Tonight with John Oliver yet? You…
-
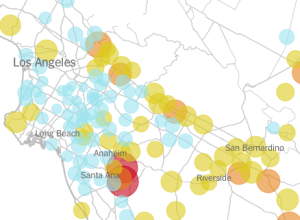
California water use per capita, by district
Matthew Bloch and Haeyoun Park for the New York Times mapped, for about…
-
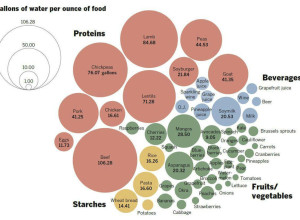
Gallons of water to produce foods
With all the talk recently about how much water it takes to grow…
-

Every Game of Thrones death
I hear there’s a show called “Game of Thrones” on the T.V., where…
-
State Income Tax Brackets Charted
I’m sure you finished your taxes months ago, but here’s a chart of…
-
Link
Purifying the Sea of PDF Data, Automatically →
Jeremy B. Merrill is working on the problem of too much data in PDF files. “My pattern solves this problem using tabula-extractor, the Ruby library (and command-line tool) that powers Tabula. It’s built to output data to CSVs or to a MySQL database.”
-
Gestalt principles for visualization
Gestalt refers to our ability to see a whole from the parts, and…
Recently for Members
Second Edition
 Visualize This: The FlowingData Guide to Design, Visualization, and Statistics (2nd Edition)
 Visualize This: The FlowingData Guide to Design, Visualization, and Statistics (2nd Edition)
New tools, refined process.
Browse by Chart Type See All →


