Your standard choropleth map shows geographic areas colored by a single variable. You’re reading this, so you’ve seen them before. What if you have two variables? Then maybe a bivariate choropleth map. Cartographer Joshua Stevens describes the method and how to make one in open-source mapping software QGIS.
Ideally, you should at least have a hunch two variables are related when creating bivariate choropleth maps. This is because bivariate maps go further than simply showing two variables all willy nilly: they show where those two variables tend to be in agreement or disagreement. If there is no expectation that the two variables might be related, a bivariate choropleth is not the right choice.
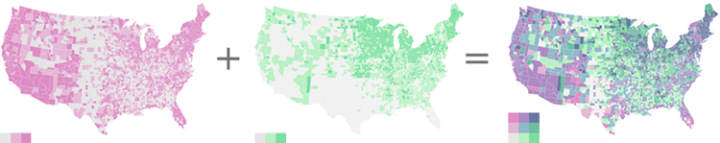
This is a story of two variables, three hues.
 Visualize This: The FlowingData Guide to Design, Visualization, and Statistics (2nd Edition)