In case you didn’t get the memo, pattern fills are back and so…
Nathan Yau
-
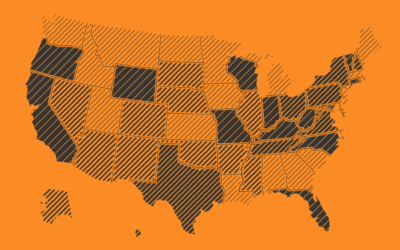
Textured SVG patterns in JavaScript
-

Nuclear war is on the ballot
Neil Halloran, creator of the interactive World War II documentary focused on deaths,…
-
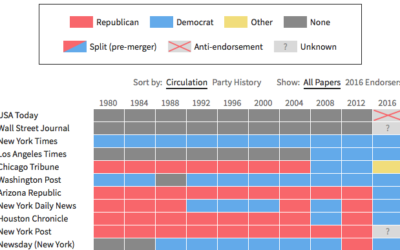
Newspaper endorsements since 1980
Noah Veltman put together a history of newspapers’ presidential endorsements since 1980 for…
-
Majority minorities
We saw the changing percentage of white people in the United States and…
-
Percentage of white people
Below is the estimated percentage of white population in the United States from…
-
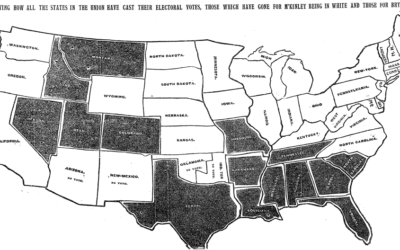
All the ways to map election results
Every election, there’s a slew of election maps that come in all shapes…
-
Two Centuries of Population, Animated
A visual history of a growing United States.
-
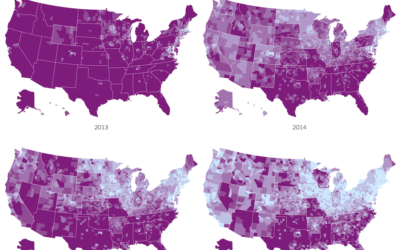
Impact of Obamacare in maps
It’s been three years since the Affordable Health Care Act. Margot Sanger-Katz and…
-
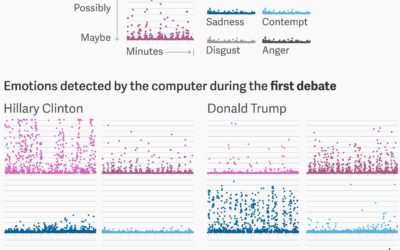
Sentiment analysis on Trump and Clinton faces during debate
For anyone who watched the presidential debates, I think it was fairly obvious…
-
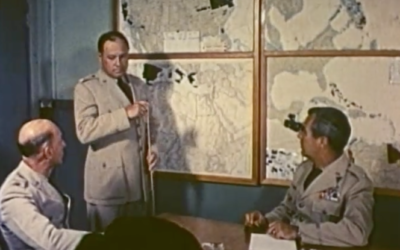
Vintage cartography and geography documentary, from 1961
This is too good not to watch. It’s a 1961 documentary on cartography…
-
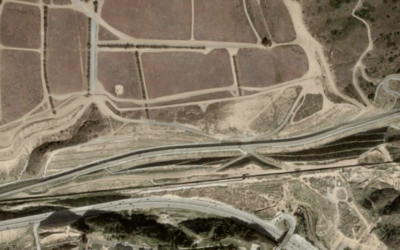
Visualizing the U.S.-Mexican border
There’s been a lot of talk about building a wall at the U.S.-Mexican…
-
Adjusting map data with Mapshaper
Map making is a finicky challenge where oftentimes your map data — points,…
-
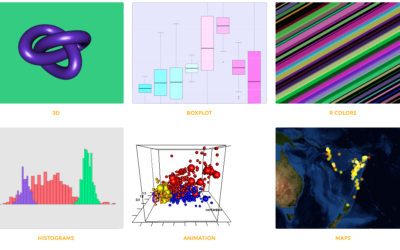
R graph gallery
One of best ways to learn visualization in any given software is to…
-
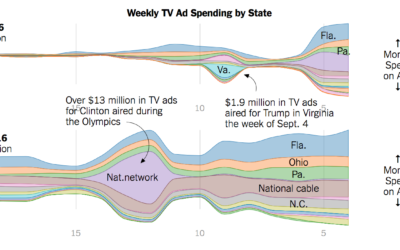
Ad spending for Clinton and Trump
Adam Pearce for the New York Times charted ad spending for Clinton and…
-
Members Only
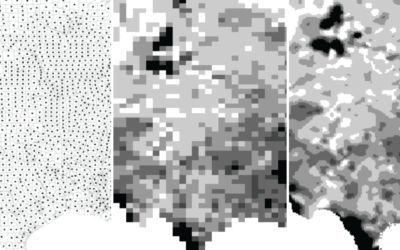
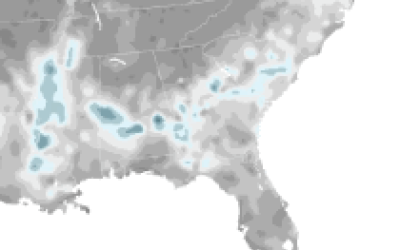
Transitioning Map, Part 1: Mapping Irregular Data with Interpolation in R
Rarely do you have evenly-spaced data across an entire geographic space. Here is a way to fill in the gaps.
-
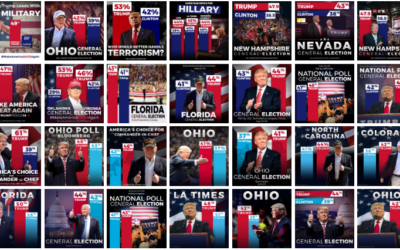
Trump bar chart baselines are the worst baselines. Sad.
The Donald Trump campaign has a habit of highlighting poll results with a…
-
Interactive charts in R
Interactive charts in R are still so-so, but if you don’t mind giving…
-

Composite photos of airplanes in flight
Photographer Mike Kelley visited airports around the world, took pictures of airplanes leaving,…
-

@HillaryClinton vs. @realDonaldTrump
A comparison of the words unique to the candidates on Twitter.
-
Using clustering to make a color scale
Choice of color scale can make a big difference in how the data…
Recently for Members
Second Edition
 Visualize This: The FlowingData Guide to Design, Visualization, and Statistics (2nd Edition)
 Visualize This: The FlowingData Guide to Design, Visualization, and Statistics (2nd Edition)
New tools, refined process.
Browse by Chart Type See All →


