The Tampa Bay Times takes you through a 3-D model of Pulse Nightclub…
Nathan Yau
-
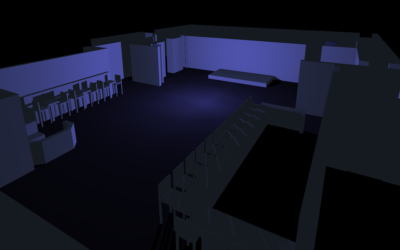
What happened at Pulse in Orlando
-

Who Still Smokes?
Two decades out from the first statewide ban on smoking in enclosed workplaces, here’s who still smokes.
-
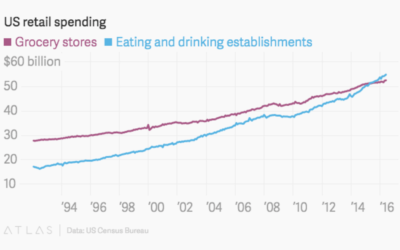
We spend more at restaurants than at grocery stores
For decades, Americans spent more money at the grocery store than at eating…
-

Motion capture dance
Really fun. “Motion capture, procedural animation and dynamic simulations combine to create a…
-
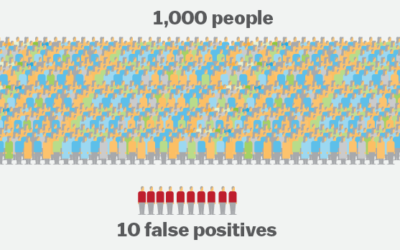
Nearly impossible to predict mass shootings with current data
Even if there were a statistical model that predicted a mass shooter with…
-
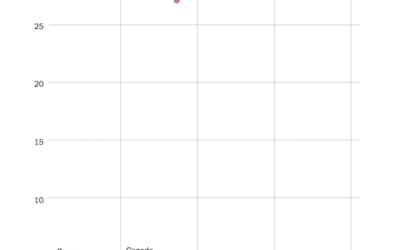
U.S. gun deaths rate is an outlier
If you look at gun death rates for other western countries and adjust…
-
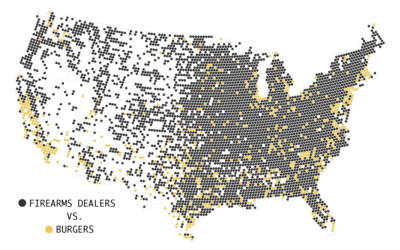
Firearms Dealers vs. Burgers, Pizza, and Coffee
As of May 2016, there were 64,432 licensed firearms dealers and pawnbrokers, which got me wondering how that compares to other businesses.
-
Americans are Growing Bigger
We keep getting bigger. Watch overweight and obesity rates move up over several decades.
-
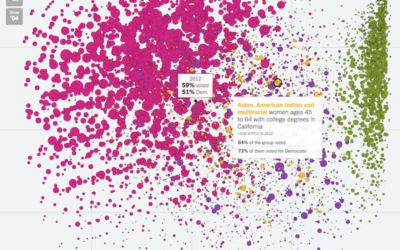
Voting habits for various demographic groups
Voter turnout and political leanings for various demographic groups play an important role…
-

A map about the people who live there
Geographers Seth Spielman and Alex Singleton used something called “geodemographic classification” to classify…
-
5 Tips for Learning to Code for Visualization
Here are some tips to get you started, based on my own experiences with R, and more recently, the JavaScript library d3.js.
-
A Course for Visualizing Time Series Data in R
Learn to visualize temporal patterns in a couple of days.
-
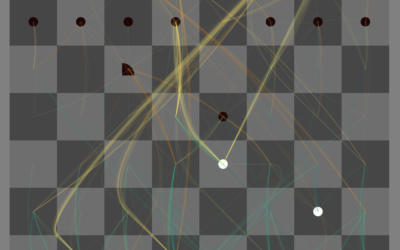
Play chess against the machine and see what it’s thinking
The Thinking Machine, by Martin Wattenberg and Marek Walczak, shows you the thought…
-
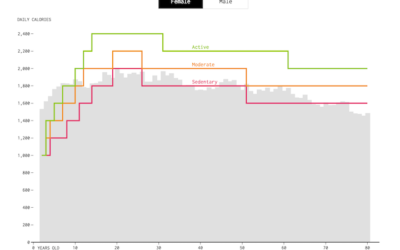
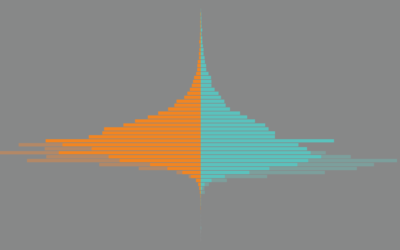
How Much We Eat vs. How Much We Need
On average, we use less energy as we age, and so we should eat less. We don’t always adjust soon enough though.
-
Where people go to and from work
With an animated take on the commute map, Mark Evans shows where people…
-
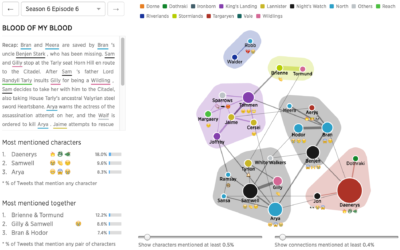
Game of Thrones discussions for every episode, visualized
I hear there’s some show called “Game of Thrones” that’s kind of popular…
-
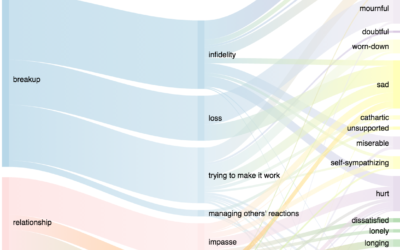
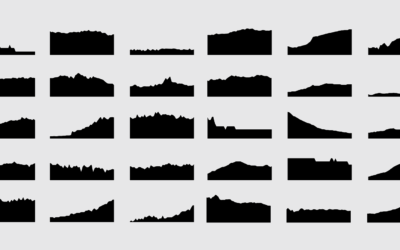
When she cried
For most, crying isn’t an especially common occurrence over a long period of…
-
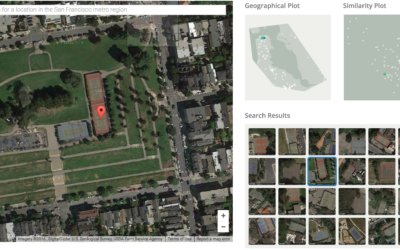
Visual search tool for satellite imagery
Terrapattern is a fun prototype that lets you search satellite imagery simply by…
-
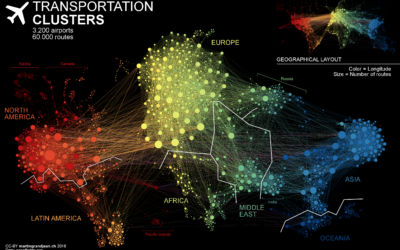
Air transportation network
Flight pattern maps are fun to look at and reveal the complexity of…
-
Automatic versus manual data analysis
Hilary and Roger touch on some interesting topics in the most recent Not…
Recently for Members
Second Edition
 Visualize This: The FlowingData Guide to Design, Visualization, and Statistics (2nd Edition)
 Visualize This: The FlowingData Guide to Design, Visualization, and Statistics (2nd Edition)
New tools, refined process.
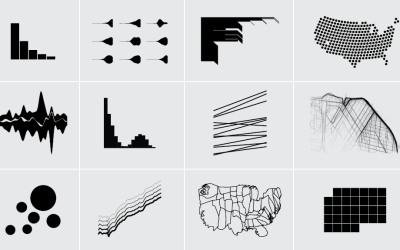
Browse by Chart Type See All →


