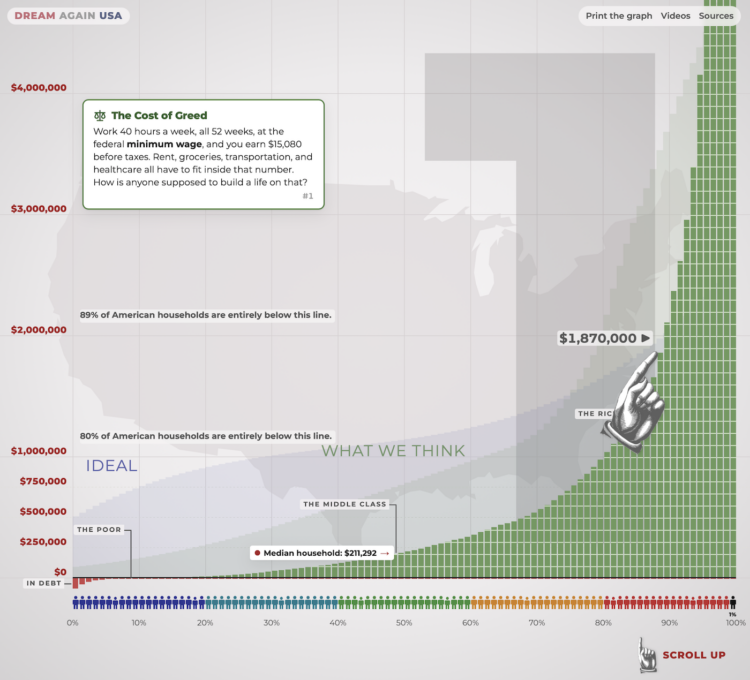
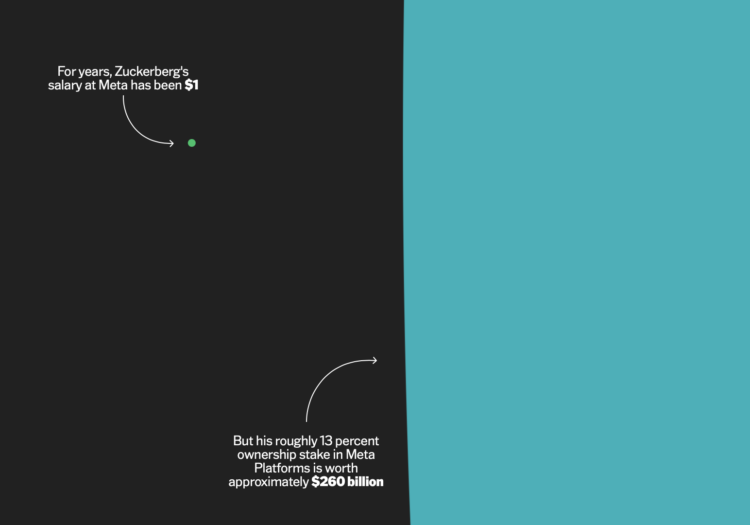
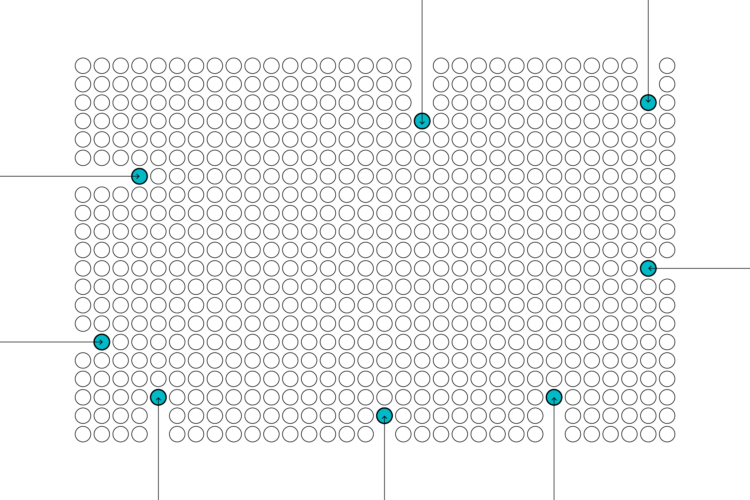
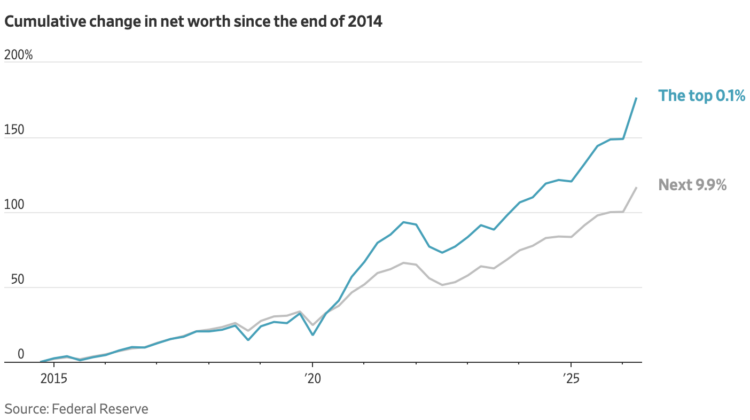
Last month, the Wealth Inequality in America video by Politizane got an update after thirteen years. The gap between the richest and the normals has only grown. This interactive version uses the very tall chart from the video to show the scale of wealth for the top 0.1% of people.
Set your expectations for how long it will take to scroll from the bottom to the top. Then reset expectations as it becomes clear that it’s annoyingly tall. Keep going. Reset again. Keep going, change the scale, reset. There is an “I quit!” button for a reason.

 Visualize This: The FlowingData Guide to Design, Visualization, and Statistics (2nd Edition)