xkcd geekdom for your slow Monday afternoon. Can you imagine being with someone…
-
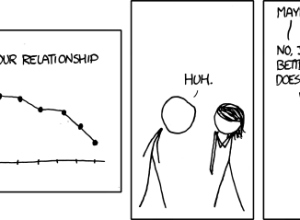
No axis labels
-
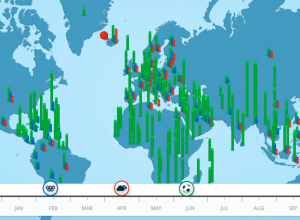
How the world searched in 2010
Google recaps search trends for the year in Google Zeitgeist 2010, from the…
-

Superheroes minimalized
Fabian Gonzalez goes minimalistic on superheroes. I like the Teenage Mutant Ninja Turtles.…
-
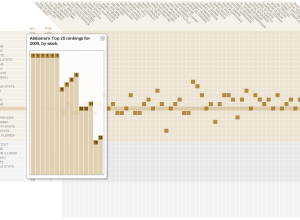
College football coaches’ ballots
Brett Coffman and Juan Thomassie for USA Today have a look at how…
-
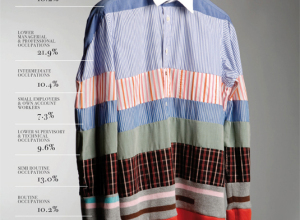
Picturing social order
Gareth Holt designed several charts and graphs for Rank: picturing the social order…
-
Data analysis is the future of journalism
Tim Berners-Lee, credited with inventing the Web, says analyzing data is the future…
-
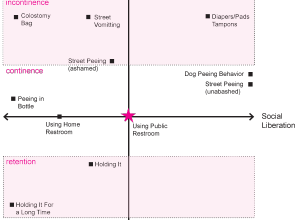
Axes of peeing in public
You might think this is a joke, but this is serious business. From…
-
Similarities between PhD dissertations
Certain fields of study tend to cover many of the same topics. Many…
-

The United States of Autocomplete
Very Small Array has some fun with Google’s autocomplete. Utah… Jazz. Kentucky… Fried…
-

Relationships on the Bold and the Beautiful explained
I don’t get soap operas. People get married, divorced, evil twins show up,…
-
Thank you, FlowingData sponsors
My many thanks to the FlowingData sponsors. They keep the lights on and…
-

Jon Stewart explains Wikileaks’ Cablegate
You’ve probably already heard and read about Wikileaks’ Cablegate. If not, Andy Baio…
-

Advanced visualization without programming – Impure
Programming can be tough in the beginning, which can make advanced visualization beyond…
-
Amanda Cox on data graphics and stuff
At New Media Days 2010, New York Times graphics editor Amanda Cox talks…
-
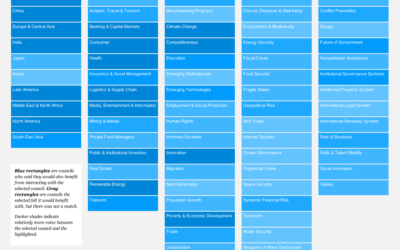
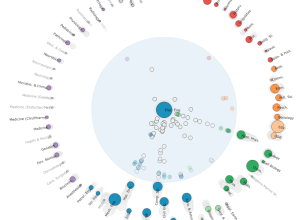
Finding Global Agenda Councils who should work together
This past month, the World Economic Forum convened in Dubai to discuss issues…
-
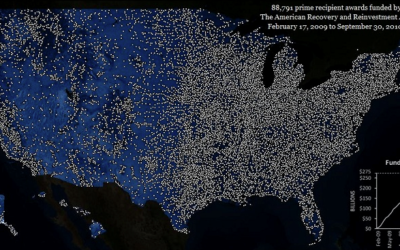
Awards from Recovery and Reinvestment Act
Between February 17, 2009 to September 30, 2010, 88,791 awards have been funded…
-
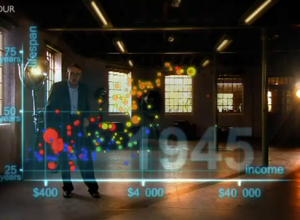
The Joy of Stats with Hans Rosling
The Joy of Stats, a one-hour documentary, hosted by none other than the…
-
How do people use Firefox?
Mozilla Labs just released a bunch of anonymized browsing data for their open…
-
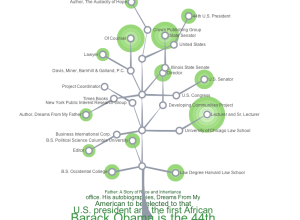
Build your LinkedIn career tree
How did you get to where you are now in your work life?…
-
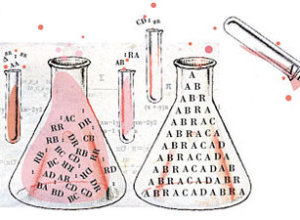
Statistics vs. Stories
Professor of Mathematics at Temple University, John Allen Paulos describes the differences between…
Recently for Members
Second Edition
 Visualize This: The FlowingData Guide to Design, Visualization, and Statistics (2nd Edition)
 Visualize This: The FlowingData Guide to Design, Visualization, and Statistics (2nd Edition)
New tools, refined process.
Browse by Chart Type See All →


