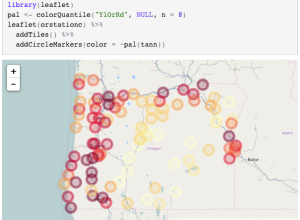
The conterminous United States always gets the attention, while Alaska and Hawaii are often left out. It is time to bring them back into view.
R
-
Members Only
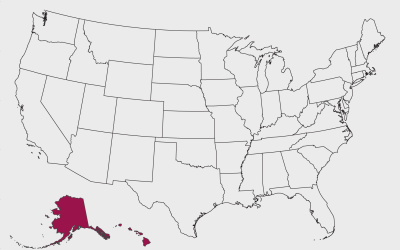
How to Make Maps in R That Include Alaska and Hawaii
-
Link
sentimentr →
R package for sentiment detection.
-
Link
quartzFonts() →
Change graphic fonts with this R function in OS X.
-
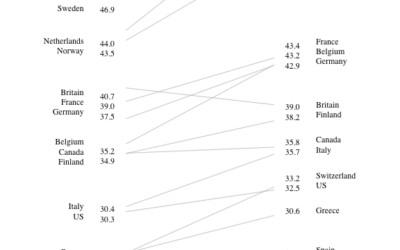
Tufte style charts in R
Lukasz Piwek is chipping away at a collection of Tufte-style charts using R,…
-
Members Only
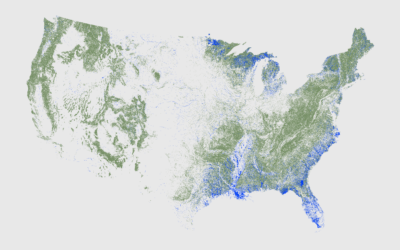
How to Map and Use GeoTIFF Files in R
It’s like working with a bunch of tiny dots, and oh look, all of sudden patterns emerge.
-
Link
stringsAsFactors: An unauthorized biography →
In almost every tutorial on this site,
stringsAsFactorsis set toFALSEwhen you read in data with a function likeread.csv(). Why isn’t is just set toFALSEby default? Of course, there’s a perfectly logical explanation. -
Members Only
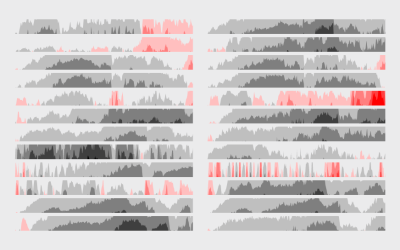
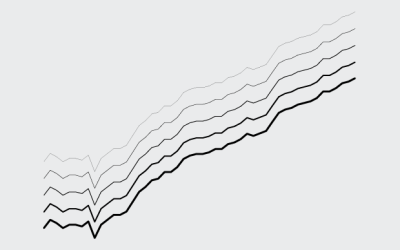
How to Make Horizon Graphs in R
The relatively new and lesser known time series visualization can be useful if you know what you’re looking at, and they take up a lot less space.
-
R Consortium for further development of community
The Linux Foundation announced the R Consortium to provide support to the R…
-

Working with R at the New York Times
Amanda Cox from the New York Times was on the Data Stories podcast.…
-
Link
imager →
An R package for image processing.
-
Members Only
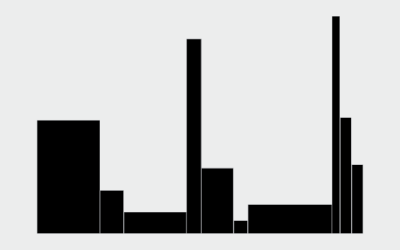
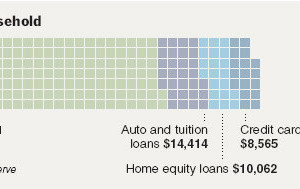
How to Make Variable Width Bar Charts in R
The code to create these bar chart variations is almost the same as if you were to make a standard bar chart. But make sure you get the math right.
-

R is quirky, flawed, and an enormous success
Most people who use R on the regular learned the language in the…
-
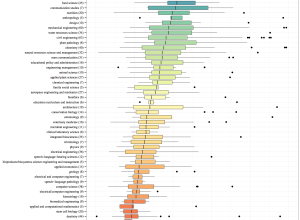
Length of the average master’s thesis
A while back beckmw found the average length of a dissertation for various…
-
Link
WikidataR →
An API client for the ‘Wikidata’ store of semantic data.
-
A Course for Visualization in R, Taking You From Beginner to Advanced
Where to start? What to learn next? Here’s a course to help take you from beginner to advanced.
-
Members Only
How to Make Dot Plots in R
It’s easy to draw dots. The challenge is to make them meaningful and readable.
-
Members Only
How to Make Line Charts in R
Learn to draw lines wherever and however you want, and you’ve got yourself some flexibility.
-
Link
Making waffle charts in R →
An alternative to the pie chart to show proportions.
-
htmlwidgets: Create interactive web charts in R
If you don’t want to bother with JavaScript but want to publish interactive…
-
Members Only
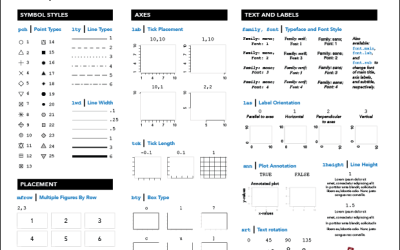
R Cheat Sheet and Guide for Graphical Parameters
You can customize graphics in R with
par(), but the docs are mostly text and just organized alphabetically. Here is a more visual reference, categorized by what you can change. Plus, a one-page printout.
Recently for Members
Second Edition
 Visualize This: The FlowingData Guide to Design, Visualization, and Statistics (2nd Edition)
 Visualize This: The FlowingData Guide to Design, Visualization, and Statistics (2nd Edition)
New tools, refined process.
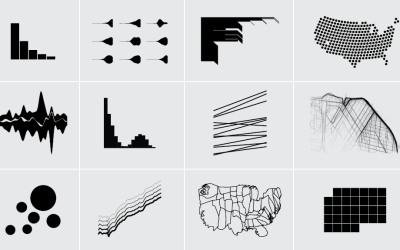
Browse by Chart Type See All →


