Lukasz Piwek is chipping away at a collection of Tufte-style charts using R, along with the code snippets. Fittingly, the project is called Tufte in R. The Tufte stuff is nice and all, but that’s not why I like this project. Two reasons.
The first is that there’s a misconception that R charts have to look a certain way. I already showed how that’s not the case, and it’s nice to see it from another angle.
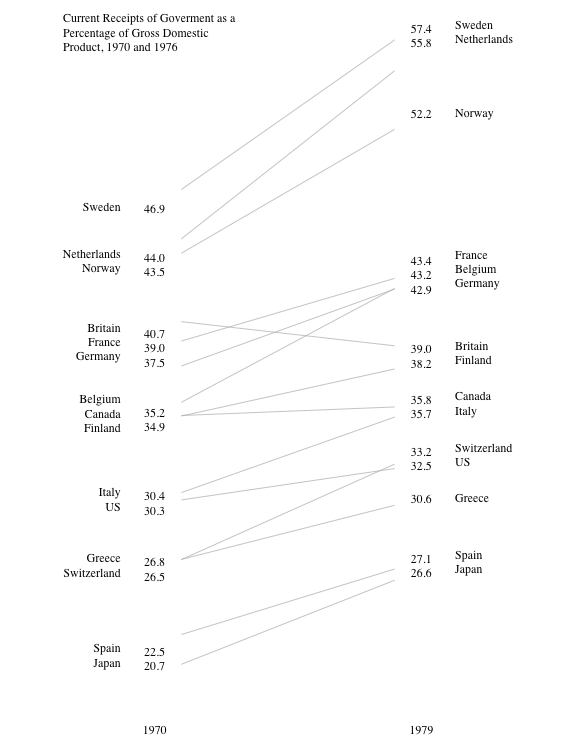
The second reason is that Piwek makes each chart using the three main graphical systems in R: base, lattice, and ggplot2, showing the flexibility that all three allow. At the end of the day, these are tools, and if you know what you’re doing, you can make what you want. [Thanks, Lukasz]
 Visualize This: The FlowingData Guide to Design, Visualization, and Statistics (2nd Edition)