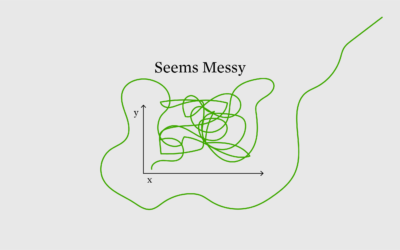
Sometimes the noise in a dataset makes it hard to see the worthwhile patterns when you visualize it. Here are chart options for you.
noise
-
Members Only
Chart Options to Cut Through the Noise and See Patterns
-
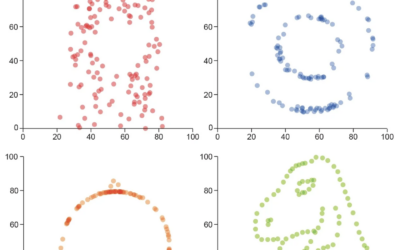
Visualization to better see true values in data
For Scientific American, Jack Murtagh describes the importance of visualization in understanding the…
-
Noise and health
The New York Times explores how noise impacts health:
Anyone who lives in… -
Members Only
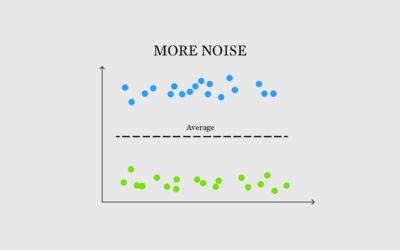
More Noise, Better Signal
Sometimes the noise, something we often try to minimize in data, makes for a better signal.
-
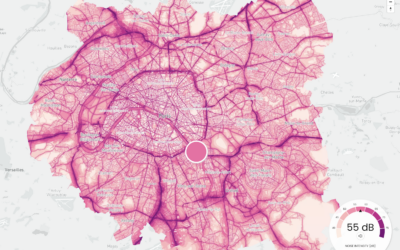
Maps of noise
Karim Douïeb, in collaboration with Possible, mapped noise in Paris, New York, and…
-
Using noise in creative coding
Oftentimes visuals generated through code can seem cold and mechanical when you’re after…
-
Generate a noise field from an image
Kjetil Golid made an interactive that lets you generate a noise field using…
-
Drawing with noise
This looks like a fun Processing tutorial by Etienne Jacob. Use noise to…
-
Common statistical interpretation mistakes
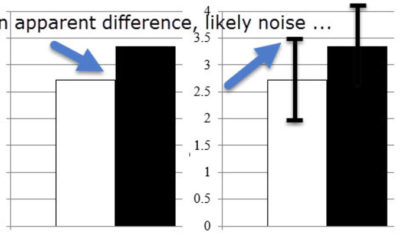
Statistics is a game of subtleties, and you lose when you don’t pay…



 Visualize This: The FlowingData Guide to Design, Visualization, and Statistics (2nd Edition)


