Here’s how to do it in R from start to finish, plus editing in illustration software. Make design choices and trade-offs for more readable charts.
layout
-
Members Only
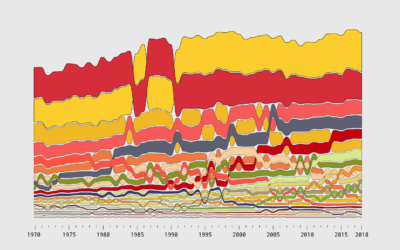
How to Make Alluvial Diagrams
Recently for Members
Second Edition
 Visualize This: The FlowingData Guide to Design, Visualization, and Statistics (2nd Edition)
 Visualize This: The FlowingData Guide to Design, Visualization, and Statistics (2nd Edition)
New tools, refined process.
Browse by Chart Type See All →


