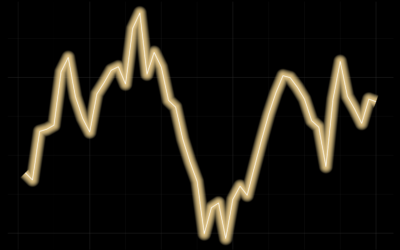
We do it because things that glow in the dark are awesome, including line charts.
ggplot
-
Members Only
Line Chart with Decorative Neon Accents
-
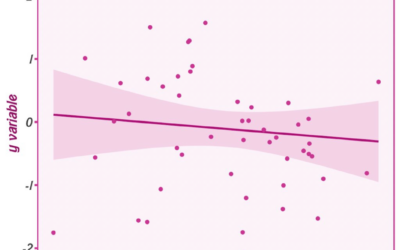
Barbie and Oppenheimer themes for charts in R
Matthew Jané made a small R package called Theme Park, which is meant…
-
Members Only
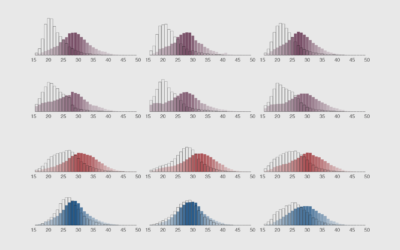
How to Make Animated Histograms in R, with ggplot and gganimate
Make them move to show a shift in distributions over time.
-
Members Only
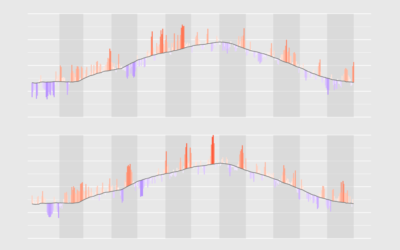
How to Visualize Anomalies in Time Series Data in R, with ggplot
Quickly see what’s below and above average through the noise and seasonal trends.
-
Members Only
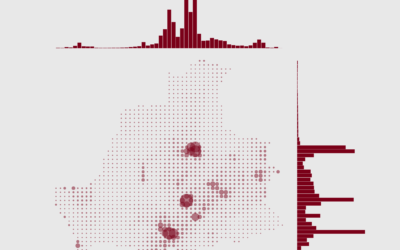
How to Make a Grid Map with Histograms in R, with ggplot
Layout multiple charts in a single view. Then adjust the scales appropriately for maximum comparability and a unified graphic.
-
Members Only
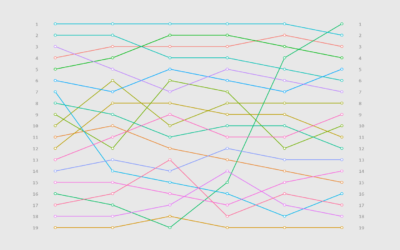
How to Make a Bump Chart in R, with ggplot
Visualize rankings over time instead of absolute values to focus on order instead of the magnitude of change.
-
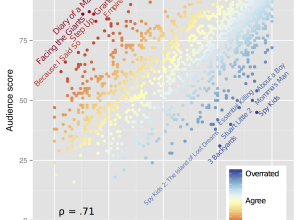
Most underrated films
Ben Moore was curious about overrated and underrated films.
“Overrated” and “underrated” are… -
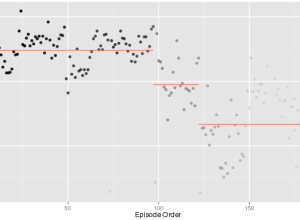
Ratings of TV shows over time
The quality of television shows follow all kinds of patterns. Some shows stink…

 Visualize This: The FlowingData Guide to Design, Visualization, and Statistics (2nd Edition)


