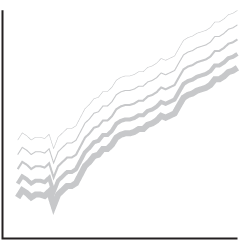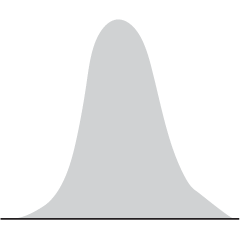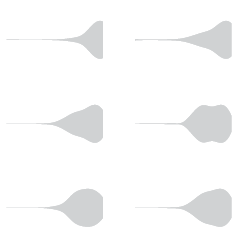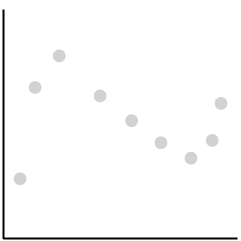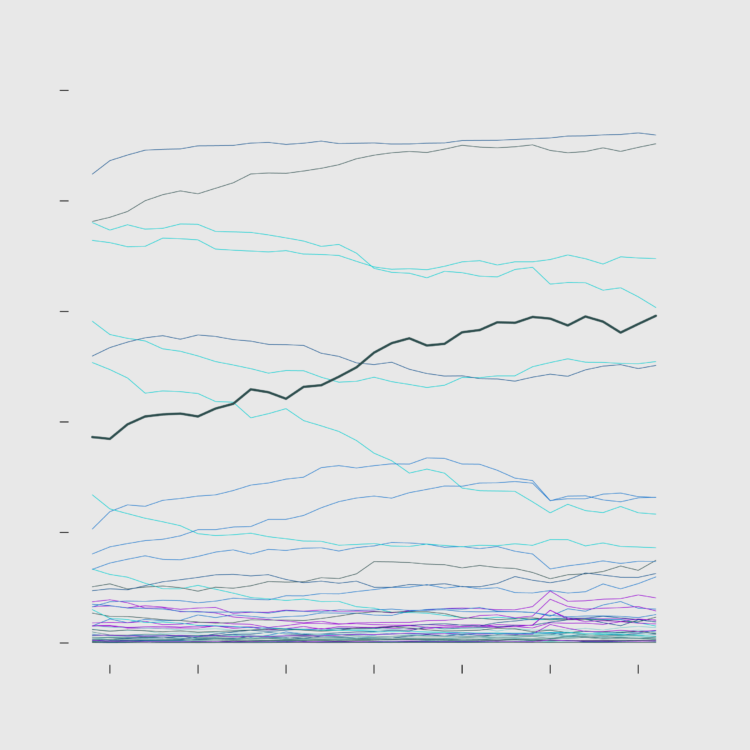
This week, I describe the many small choices one must make while working on a set of charts.
This week, I describe the many small choices one must make while working on a set of charts.
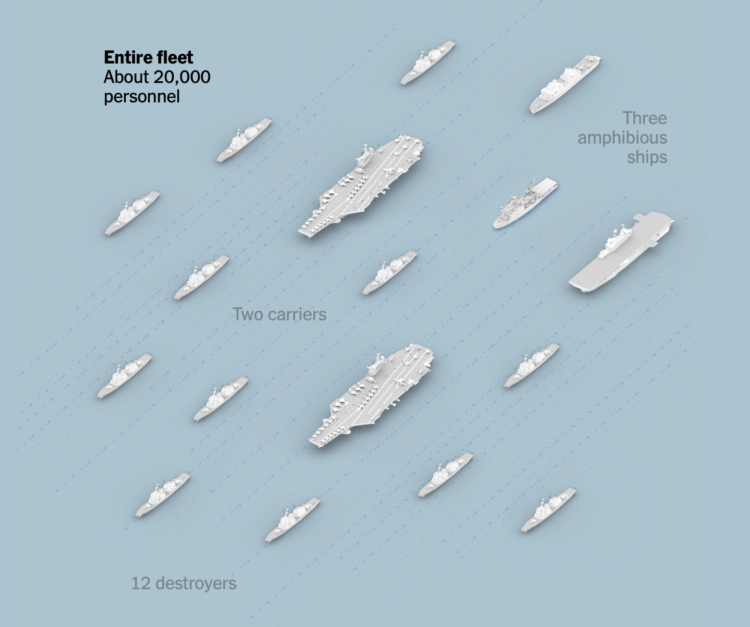
There are thousands of crew members aboard U.S. warships in the Middle East. They need a regular food supply. Aircraft on the ships need fuel to lift off. For the New York Times, Simon Ducroquet and John Ismay illustrate the challenges for the U.S. Navy when a base is destroyed and carriers need to navigate outside the range of Iranian missiles and drones.
I appreciate the maps and illustrations to show how fuel and ships must flow for the fleet to remain functional.
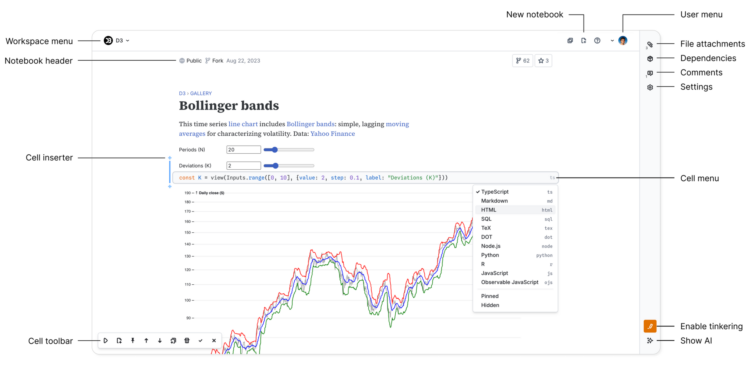
Observable, known for visualization-centric notebooks to share code, restarted fresh to adjust for this new chapter in making things with computers.
We obviously cannot pretend that AI does not exist; large language models are astonishingly capable and are profoundly changing the world, and this change appears to be only accelerating. Likewise we cannot do nothing, “watching and waiting, observing from afar and merely hoping for the best” as Pope Leo writes. We therefore seek, in what little way we can with our humble notebook, to apply this technology in a way that encourages human understanding, collaboration, and creativity.
Years ago, the best way to learn how to visualize data with code was to study one-off snippets via Mike Bostock’s code blocks. Observable notebooks spun off this joy of sharing and learning code, and you can see bits in visualization across the web. Of course, the work is different now, so this update seems inevitable.
I’ve never been much into code notebooks, but I’ll have to kick the tires on this.
Due to Covid, India’s census count is overdue by five years. But they’re getting things going, which involves hiring 3 million people to count around one and a half billion. For Bloomberg, Satviki Sanjay describes the challenge.
The first order of business was to find enough people — more than 3 million — to knock on every door in the country. Teachers and low-level bureaucrats were ordered to participate and offered 25,000 rupees ($262) for a task that will likely take several weeks. “We knew we’d have census duty, but I had no idea what exactly that might entail,” says Priyanka Yadav, a 35-year-old primary school teacher from Gorakhpur, a district of about 4 million (she’ll be able to give you a more precise figure next year) 13 hours east of Delhi by train.
In contrast, the U.S. Census Bureau hired about 500,000 workers for the decennial count.
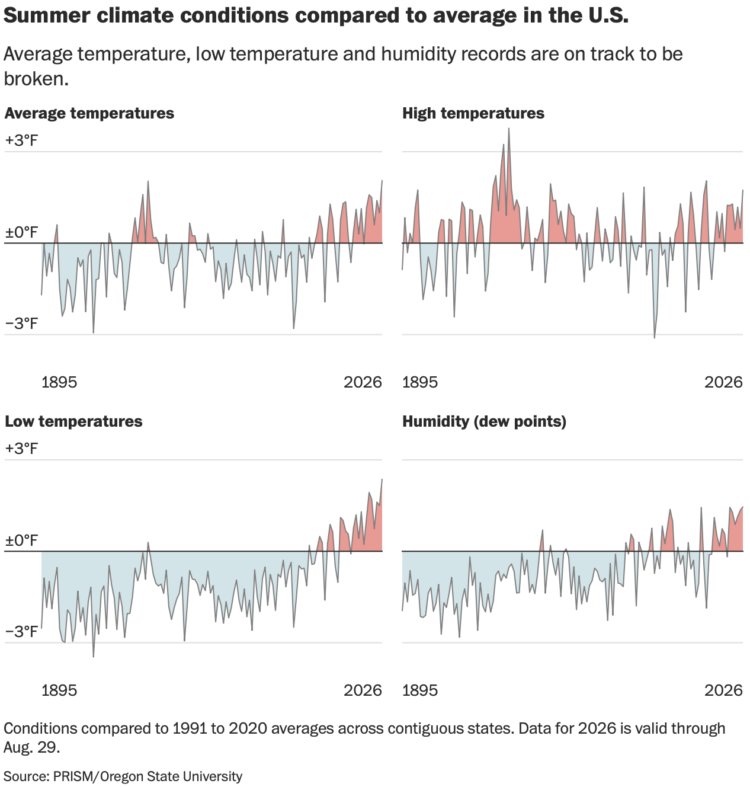
The summer of 2026 will most likely be the hottest summer on record since 1936. Part of that is hot days, but more significantly it’s cooling down less at night, which raises the overall average. For the Washington Post, Ben Noll reports.
In the U.S., one of this summer’s most consequential trends unfolded while most people slept. Nighttime temperatures smashed records, reaching their highest levels — 2.37 degrees above average — across the U.S. as a whole, on track to beat the previous record set in 2021 by almost half a degree.
That’s important because warmer nighttime temperatures not only make it more challenging to sleep, but also to recover from the heat of the day.
The values in the charts above are compared to average temperature between 1991 to 2020. That seems kind of arbitrary? But the trend for low temperatures is clear.
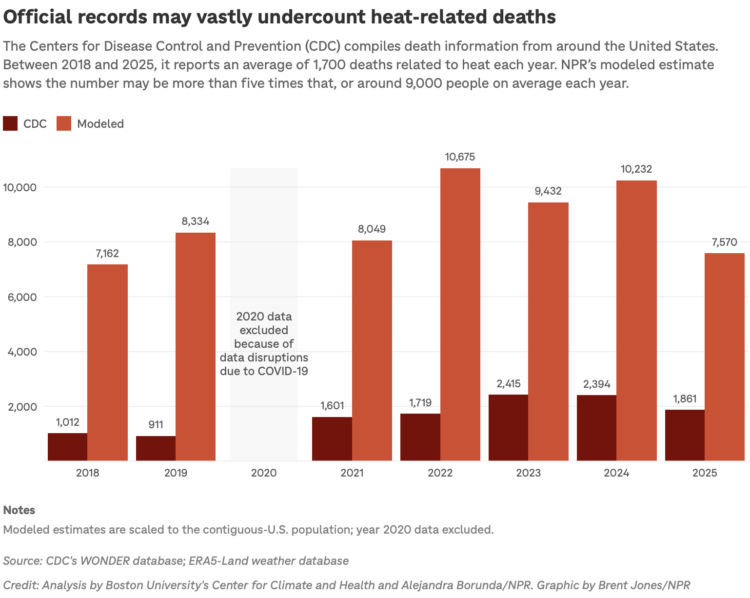
The U.S Centers for Disease Control and Prevention count causes of death, and heat is included in the tabulations. However, it is likely that the reports for heat are undercounts. NPR, in collaboration with researchers at Boston University, modeled mortality due to heat and estimate the true counts are five times higher than reported.
Years are getting hotter, so it grows more important to understand the effects, even if there are people who refuse to believe the data.
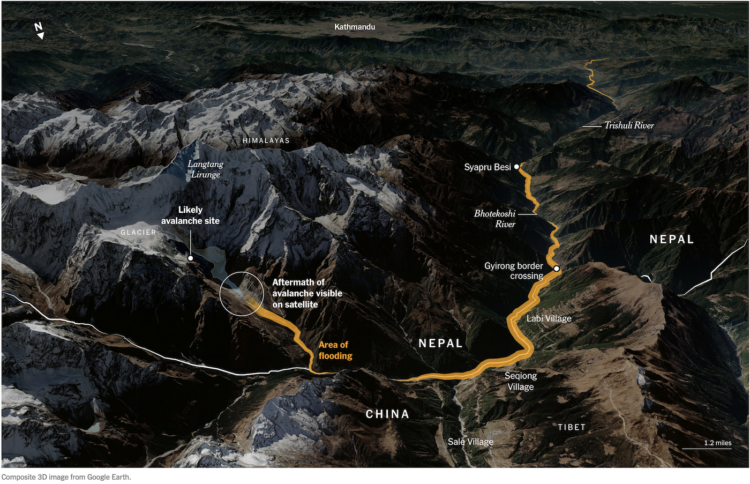
For the New York Times, Pablo Robles, Leanne Abraham, and Josh Holder mapped the flood in Nepal, which started with an avalanche in the mountains and stretched for 40 miles. There are currently 4,400 people missing.
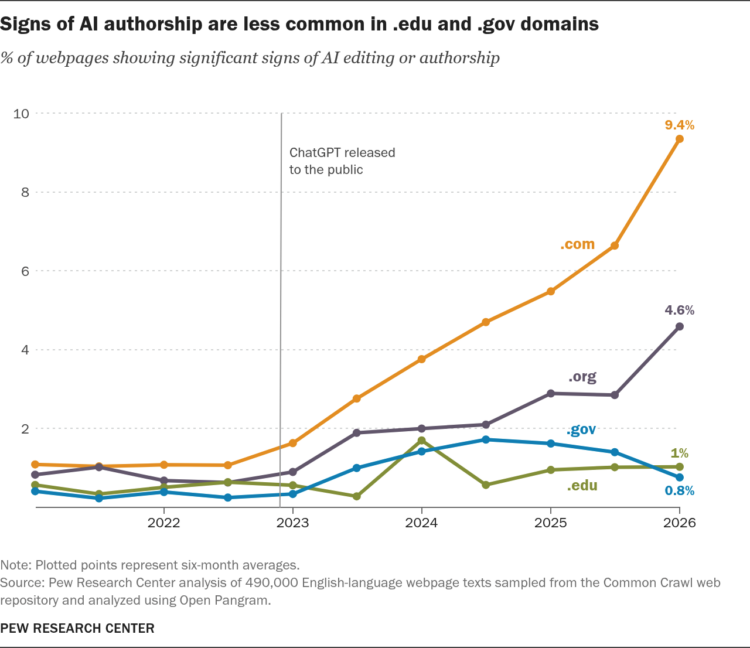
It is trivial to generate bodies of text on infinite topics, so of course the web is filled with the stuff. Pew Research tried to estimate how much.
To explore this question, we used the Common Crawl web archive to collect almost half a million English-language webpages from the past five years – starting a couple of years before the release of ChatGPT. We then ran the text of those pages through an AI detection tool called Open Pangram to see how many of them were likely written or substantially edited by AI.
In a random sample, 9% of English language webpages were marked as having signs AI authorship. When looking at only pages that went live after the release of ChatGPT, they found a much a higher rate of 1 in 3.
Caveats considered, such as the accuracy and false positives with Open Pangram, the upward trends are clear. I am not sure how I feel about this, but I do not like that the em dash and Oxford comma are now a mark of AI usage.
“We regularly evaluate our programs, tools and services and make adjustments based on those assessments,” a notice posted to the Mechanical Turk, or MTurk, website said. “Following an assessment, we’ve made the decision to close AWS Mechanical Turk, effective September 30, 2026.”
Launched in 2005, Mechanical Turk matches legions of workers with simple digital jobs, or “Human Intelligence Tasks,” that typically pay out a few cents per task. They include labeling data, transcribing audio or video or answering surveys.
Amazon founder Jeff Bezos described the service as “artificial artificial intelligence,” as it farmed out tasks that could be easily completed by humans but proved too challenging for computers.
In its heyday, Mechanical Turk was a great way for visualization folks to gather data for specific tasks from real people. Kind of sad to see it shutdown, but so it goes on the internet.
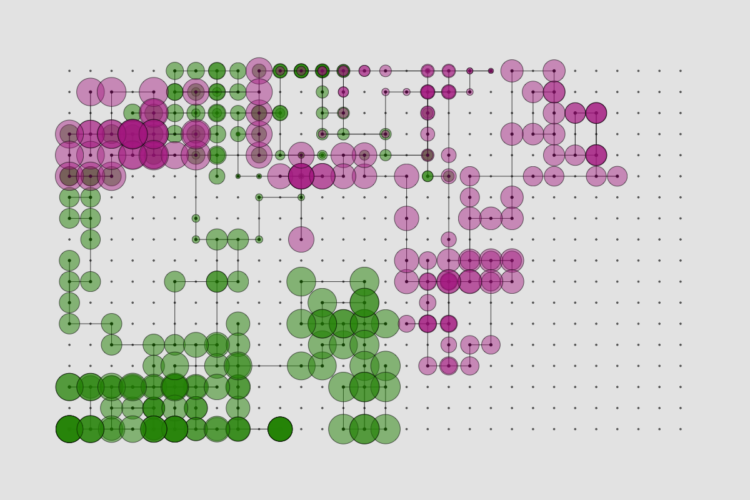
Here is what happened in August.
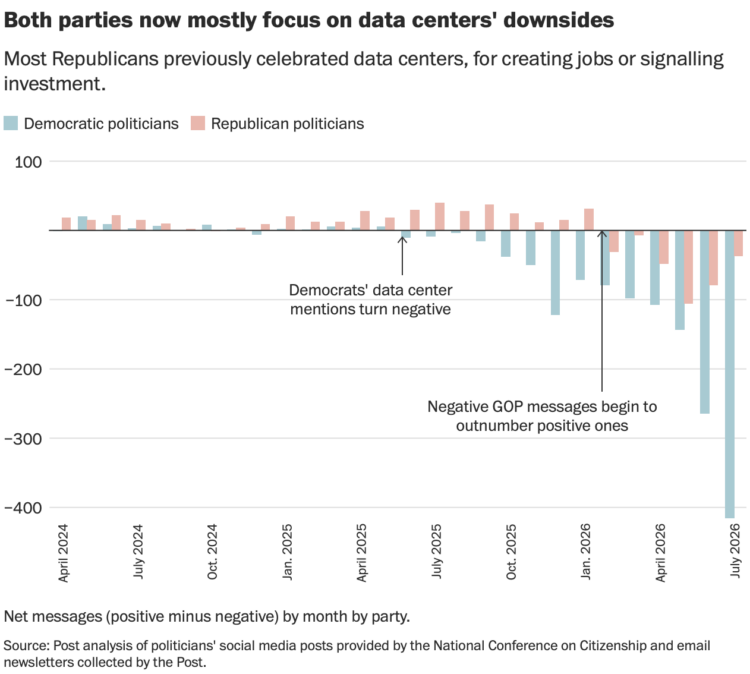
For the Washington Post, Jeremy B. Merrill analyzed newsletters and social media posts from politicians to estimate messaging around data centers.
Democrats were negative since last year and have grown more negative since.
Republicans were focused on the upside of data centers but messaging flipped in the beginning of 2026. Although based on the chart above, it looks like Republicans could trend back up.

There is a simple law from John Hack that says the length of a river is proportional to its drainage area. For Quanta Magazine, Natalie Wolchover describes how this law applies everywhere.
In 1957, a U.S. Geological Survey scientist named John Hack discovered the most important law of river networks. In rivers and streams in Virginia and Maryland, Hack measured the length of each stream and the area of the land that slopes toward that stream and therefore drains into it, called its basin or drainage area. What he discovered is now known as Hack’s law: Any stream, from the littlest brook to the mightiest river, has a length that’s proportional to its drainage area raised to the power of 0.6. (In symbolic form: L ~ A^0.6.) There’s a bit of variance around that 0.6 value — Earth is, after all, a complicated place — but “the general regularity of the relation is nevertheless remarkable,” Hack wrote. “Stream lengths tend to increase proportionally to the 0.6 power of the drainage area, regardless of the geological or structural characteristics of the area.”
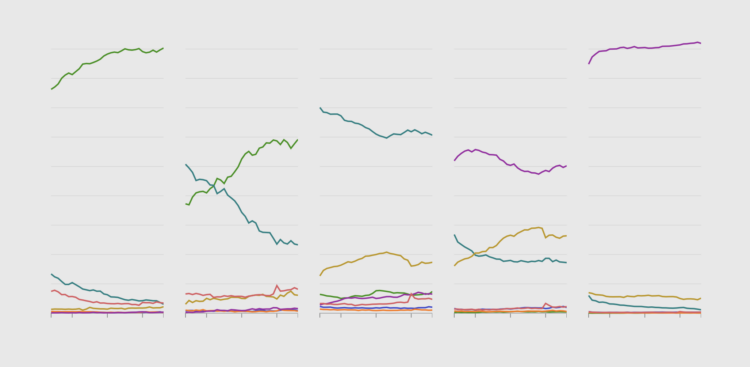
About 62% of civilians in the United States, 16 years and older, said they either had a job or were looking in July 2026. Of course this number varies a lot depending on what group of people you look at.
Kieran Healy, a professor of sociology at Duke University, gives an enjoyable lecture on the limits of trust in data visualization.
We were already approaching a place where people could say what they wanted with charts, regardless of what the data really showed. Recent technology has only sped up the process. I just kept wondering where this ends up in five or ten years.
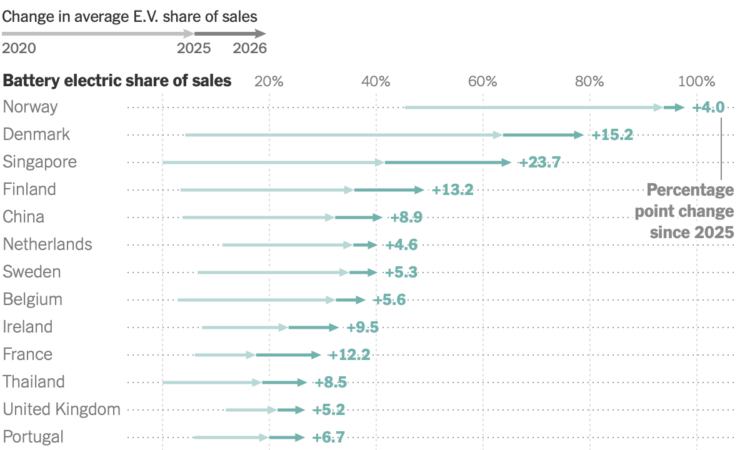
For the New York Times, Mira Rojanasakul and Brad Plumer report on the rise in electric vehicle registrations around the world. The snippet of a chart above shows the change between 2020 and 2025 with a faded arrow. This provides a point of comparison showing the more recent jump this past year. I like it.
The U.S. is much farther down the list showing a decrease in registrations year-over-year.
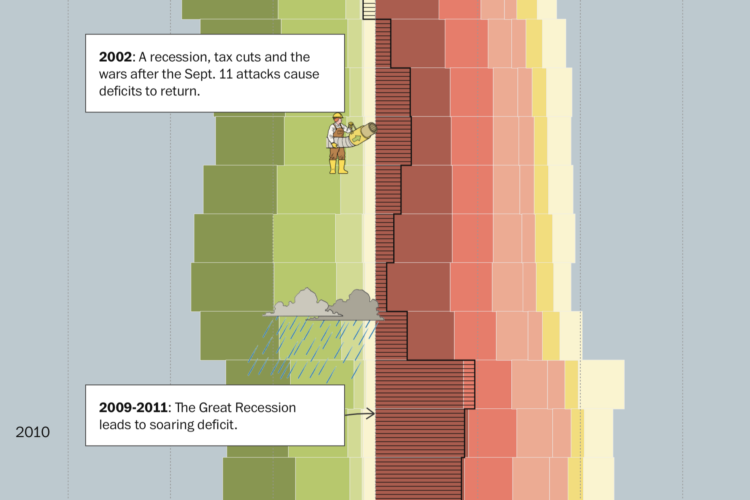
When you spend more than you make, you get debt. For the Washington Post, Youyou Zhou, with illustrations by Kyle Ellingson, visualized the difference over time for the United States.
A long stacked bar chart provides a backdrop of revenue and spending, and the animations give a little something to highlight significant spikes.
The debt has been running up for decades. It’s as if the government doesn’t even care.

This week is about changing perspectives so we can find and visualize new insights.
Spirit Airlines went bankrupt for real this time, and Google bought the data. AJ Dellinger reports for Gizmodo:
Google’s winning bid in the auction was priced at $10 million, outbidding Mercor, an AI training data giant. According to a notice published on the US Bankruptcy Court for the Southern District of New York’s docket, as the winning bidder, Google is now the proud owner of more than 100 million company emails, 500 million Microsoft Teams chats, 30 million lines of code, development metadata, software models and algorithms, as well as revenue, aircraft operations and employee productivity data.
Companies continue to spread their tentacles to wherever data resides. The AI training models need to be fed, and they already ate all the data on the internet.
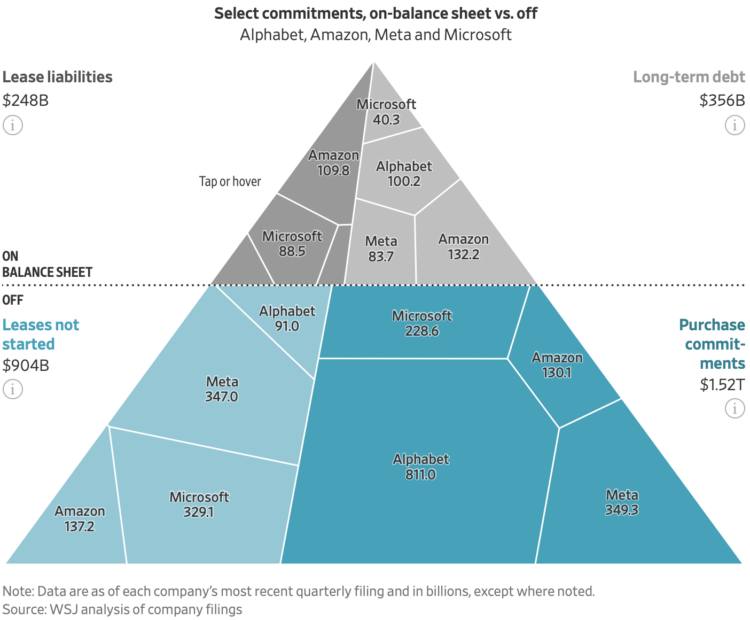
For the Wall Street Journal, Peter Rudegeair and Peter Santilli report on the trillions (with a t) of dollars slated for later spending by big tech:
Nine top tech companies had some $3 trillion of off-balance-sheet commitments mostly related to AI, according to a Wall Street Journal analysis of footnotes in their most recent securities filings. Those obligations are growing faster than traditional “capex,” which totaled about $600 billion over the past year they reported, and were about triple what the companies owe under their outstanding leases and long-term borrowings.
That is a lot of money.
Mostly, the triangle Voronoi treemap caught my eye. It’s been a while since I’ve seen one of those. I wish they had shown all $3 trillion of commitments to match the headline instead of just the four companies. The math threw me off for a second.
 Visualize This: The FlowingData Guide to Design, Visualization, and Statistics (2nd Edition)
New tools, refined process.