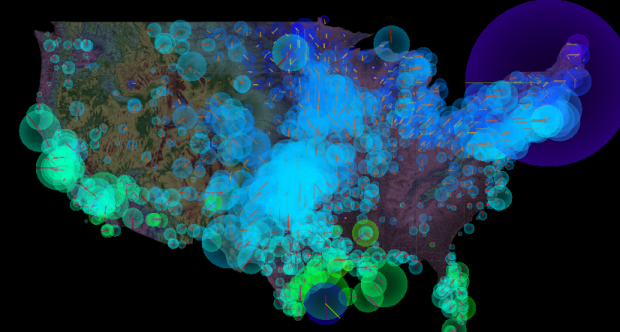
• Membership
  • Newsletter
  • Projects
  • Learning
  • About
  • Member Login
  • Causation is real, people

    December 15, 2011

    Topic

    Statistics  /  causation, correlation, humor

    Stop global warming. Decrease the National Science Foundation’s R&D budget. It’s so easy. More lessons on correlation and causation found here.

  • What Facebook knows about you

    December 14, 2011

    Topic

    Data Sources  /  facebook, privacy

    Facebook logs and saves a lot of data about you and what you do on their site. This shouldn’t be surprising given the more time people spend on Facebook, the greater the cash flow, but just how much data do they store? Austrian law student Max Schrems, because European law states that citizens can do this, requested all the data Facebook had about him. He got back a CD with 1,222 PDF files.
    Read More

  • Fox News still makes awesome charts

    December 12, 2011

    Topic

    Mistaken Data  /  Fox News, unemployment

    Charts and graphs are great, because they can let you see a pattern that you might not see in a spreadsheet, but they only work when you use the actual data. Fox News isn’t doing themselves any favors by putting up this chart. It shows the recently announced drop in unemployment rate to 8.6 percent as a non-change.
    Read More

  • Mapped: Transportation check-ins on foursquare

    December 12, 2011

    Topic

    Maps  /  foursquare, traveling

    Transportation check-ins on foursquare. This is from this past Thanksgiving, but relevant again with Christmas around the corner. White represents check-ins on highways and roads (really?), orange is for trains, and blue is of course is same-day check-ins at airports. I guess no one takes Amtrak cross-country anymore.

    [foursquare via datavis]

  • Corruption versus human development

    December 9, 2011

    Topic

    Statistical Visualization  /  corruption, Economist, human development

    Transparency International released annual data for the Corruption Perceptions Index. The Economist plotted it against the UN’s Human Development Index:

    Comparing the corruption index with the UN’s Human Development Index (a measure combining health, wealth and education), demonstrates an interesting connection. When the corruption index is between approximately 2.0 and 4.0 there appears to be little relationship with the human development index, but as it rises beyond 4.0 a stronger connection can be seen. Outliers include small but well-run poorer countries such as Bhutan and Cape Verde, while Greece and Italy stand out among the richer countries.

    Interesting, although I suspect that the indices have some factors in common.

    [The Economist via @mikeloukides]

  • Substratum: A series of interviews with smart people

    December 8, 2011

    Topic

    Design  /  interviews

    It’s always nice to hear from the people who are the best at what they do. Data visualization studio, Interactive Things has an interview series going, Substratum, that asks designers and artists the same set of questions. The most recent issue is with Amanda Cox from The New York Times and Nicholas Felton, who you know from his annual Feltron reports and now at Facebook.

    Amanda Cox, the chart marker, on how her work and goals have changed over the years:

    At one point — I call it my impressionist phase — I was really interested in making things abstract but interesting and beautiful. And then I had a “curves are fun” phase for a while where I was really into curved things. And then I had an “intentional simplicity” phase for a while, like, how stripped down can you make something and have it still be interesting? I don’t know what my current phase is, but it’s kind of an “aspirational reporting” phase. I’m not that great of a reporter yet, but I’m thinking a lot about how we can stop using the same information that’s already on the Internet and just remix that. I want to start working with more, deeper information, information that’s harder to surface.

    This is coming from someone who has won an international award for being the best. So much to learn, I have.

    [Substratum]

  • Bach Cello Suites visualized

    December 8, 2011

    Topic

    Data Art  /  Bach, interactive

    As a resident at Eyebeam, Alexander Chen visualizes the first Prelude from Bach’s Cello Suites:

    Using the mathematics behind string length and pitch, it came from a simple idea: what if all the notes were drawn as strings? Instead of a stream of classical notation on a page, this interactive project highlights the music’s underlying structure and subtle shifts.

    Interaction version here. Charming.

    [Alexander Chen via @blprnt]

  • Guides  /  critique, getting started

    On low-quality infographics

    This has been sitting in my drafts folder for a few months. Figured…

    Read More
  • Visualize This: Signed copies available

    December 7, 2011

    Topic

    The Book

    Quick announcement: I have a handful of signed Visualize This copies available in case you’re looking for a gift for that data geek cousin or you’re up for some learning over the holidays. I only have a limited supply, so grab a copy before they’re gone. And of course, you can still get an untarnished version at the major booksellers.

  • Rise and fall of riot rumors on Twitter

    December 7, 2011

    Topic

    Network Visualization  /  Guardian, interactive, riots, rumors, Twitter

    During the riots in London this past summer, a lot of information spread quickly about what was going on. Some of that information was true and some was not so true. The Guardian explores this spread of information on Twitter, and how fact and fiction seem to reveal themselves on their own:

    A period of unrest can provoke many untruths, an analysis of 2.6 million tweets suggests. But Twitter is adept at correcting misinformation – particularly if the claim is that a tiger is on the loose in Primrose Hill.

    Other rumors include when rioters cooked their own food at McDonald’s (false), London Eye was set on fire (false), and Miss Selfridge was set on fire (true).

    Each bubble represents a tweet and is sized by number of followers the tweeter has. The big one is usually the orignal tweet and the small ones that cluster around are retweets. Then the colors represent tweets that support, oppose, question, or comment. So when you play the animation for each rumor, bubbles swiftly pop up at the rumor peaks and then settle at true or false.

    You can also use the scroll to move to a certain point in time, and roll over bubbles to see the tweets.

    Really nice graphic and worth a look.

    [Guardian via @jakeporway]

  • Every death on the road in Great Britain

    December 7, 2011

    Topic

    Maps  /  accidents, BBC, roads

    As part of their series on road accidents, BBC News mapped every recorded death on the road in Great Britain, from 1999 to 2010. That’s 2,396,750 road crashes. As you’d expect, the map looks a lot like population density, but check out the videos, which show twelve years of data compressed as if it were one week, played out over a few minutes. Each light represents an accident.

    Contrast with road fatalities in the United States.

    Update: The BBC headline and copy seem to conflict, but this seems to be just accidents, and I’m not sure when casualties enter the equation. At 2.4 million crashes over 12 years, that’s about 455 per day.

    [BBC News via @aaronkoblin]

  • 40 years of boxplots

    December 6, 2011

    Topic

    Statistical Visualization  /  boxplot, John Tukey

    Famed statistician John Tukey created the boxplot in 1970. It shows a distribution summary in a small amount of space. Hadley Wickham and Lisa Stryjewski look back on the old standby and its evolution up to present. Keep it in mind, while still used today, the boxplot was created with pencil and paper.

    One of the original constraints on the boxplot was that it was designed to be computed and drawn by hand. As every statistician now has a computer on their desk, this constraint can be relaxed, allowing variations of the boxplot that are substantially more complex. These variations attempt to display more information about the distribution, maintaing the compact size of the boxplot, but bringing in the richer distributional summary of the histogram or density plot. These plots can overcome problems in the original such as the failure to display multi-modality, or the excessive number of “outliers” when n is large.

    Alright, computers are useful. I guess.

    [40 years of boxplots]

  • What seven billion people looks like

    December 5, 2011

    Topic

    Maps  /  density, Fathom, population

    Form design intern at Fathom, James Grady, maps population density in Dencity:

    Dencity maps population density using circles of various size and hue. Larger, darker circles show areas with fewer people, while smaller, brighter circles highlight crowded cities. Representing denser areas with smaller circles results in additional geographic detail where there are more people, while sparsely populated areas are more vaguely defined.

    While we’ve seen population density mapped, both directly and indirectly, the circle approach adds a different aesthetic that seems to add something about what it’s like to live somewhere. Compare to a broader country-level map or one that uses only color. Doesn’t this version feel like more?
    Read More

  • Smiley installation shows the mood of a city

    December 2, 2011

    Topic

    Data Art  /  installation, smiley, video

    Project Stimmungsgasometer (say what?) is a giant smiley face that changes based on the mood of Berlin citizens. When they are collectively “happy” the light is a smile, and when they are not, it is a sad face. Input comes from facial recognition software that takes in video from a strategically placed camera. The software estimates whether passers by are happy or not, and then installation changes accordingly.
    Read More

  • Shan Carter on data storytelling

    December 1, 2011

    Topic

    News  /  Shan Carter, video

    Shan Carter, who makes interactive graphics for The New York Times, talks telling stories with data in his aptly named presentation, “How I tried for years to find the perfect form for interactive graphics, how I failed, and why, whether a perfect form exists or not, I’ve stopped my desperate pursuit.”

    He starts with finding a balance between statistical analysis and story, and then finishes with the kicker that visualization is a form of communication just like a movie or a book. And that carries with it its own implications.

    The short Q&A at the end is pretty good, too. Just ignore the first obligatory question on how you make graphics that get more traffic.

    [Video Link via @mericson]

  • Page 301 of 392
  • <
  • 1
  • ...
  • 298
  • 299
  • 300
  • 301
  • 302
  • 303
  • ...
  • 392
  • >

Analyze, visualize, and communicate data usefully, beyond the defaults.

Become a member →

Recently for Members

May 8, 2025
When the data is not what it seems

May 1, 2025
Finding the Right Charts

April 24, 2025
Visualization Tools, Datasets, and Resources – April 2025 Roundup

April 17, 2025
Breaking Out of Chart Software Defaults

April 15, 2025
Line Chart with Decorative Neon Accents

Browse by Chart Type See All →

Calendar Heatmap Radar Chart Ternary Plot Barcode Chart Chord Diagram Grid Map Variable Width Bar Chart Dot Density Map Bump Chart

Browse By Topic

  • Visualization

    Seeing data

  • Maps

    Seeing geographic data

  • Infographics

    Explaining data

  • Networks

    Connecting data

  • Statistics

    Analyzing data

  • Software

    Working with data

  • Sources

    Getting data

  • Design

    Making data readable

Get the Book

Visualize This: The FlowingData Guide to Design, Visualization, and Statistics

Available now.

Order: Amazon / Bookshop

Made by FlowingData

  • The Process

  • Data Underload

  • Chart Everything

  • Guides

  • Books

  • Shop

  • About
  • Contact
  • Newsletter
  • LinkedIn
  • Instagram
  • Bluesky
  • RSS
Copyright © 2007-Present FlowingData. All rights reserved.