• August 31, 2012

    Topic

    Maps  / 

    Horace Mitchell, director of the NASA Scientific Visualization Studio discusses the process behind their visualization that shows estimated surface currents around the world, Perpetual Ocean.

    Once we have the data set, then we bring two things to bear. I’m a scientist by training — I have a doctorate in physics and I did research for about a decade — but everyone in my group has a level of understanding what the point is of all these animations. We know what we’re doing, and what we’re trying to bring out. Then, the team is amazing — working together, they play off of each other and every person in the team has a separate project they’re working on. They’re always bouncing ideas off of each other. As a result, over the last 10 or 20 years, we’ve gotten very good at figuring out what we can do. We have tools we can bring out at the drop of a hat to do certain kinds of visualizations. But we’re always thinking about the next thing, and what we can’t do yet.

    People miss that very first part a lot of the time: “Once we have the data set…” No data means nothing to show.

  • The fictional map of physics by Bernard H. Porter in 1939 reads:

    Containing a brief historical outline of the subject as well be of interest to physicists, students, and laymen at large. Also giving description of the land of physics as sen by the daring souls who venture there and more particularly the location of villages (named after pioneer physicists) as found by the many rivers. Also the date of founding of each village. As well as the date of its extinction and finally collection of various and sundry symbols frequently met with on the trip.

    I nearly failed my advanced physics in engineering courses in college, so a lot of this is lost on me, but it feels very xkcd-like (despite being made seven decades ago).

    [via Strange Maps]

  • Photographer David Johnson took long-exposure shots of fireworks. Fireworks already leave trails when they go off, the long-exposure versions create a spiky ball effect. Pretty. [via]

  • Randal Heeb convinced a New York City judge that poker isn’t a game of luck, using a 120-page report full of analysis and charts.

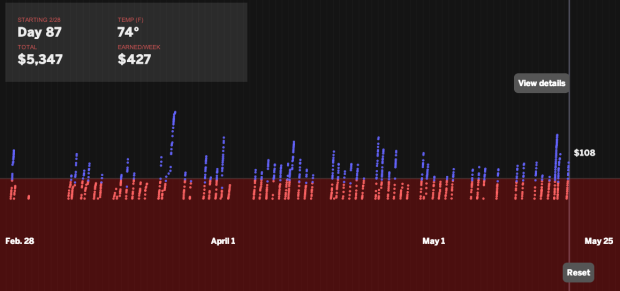
    Judge Weinstein, relying on the research of Randal Heeb – an economist, statistician and poker player – found that while luck determines what cards a player gets, skill plays the bigger role in a player’s ultimate success. With such charts as “Win-Rate Comparison: King Nine Offsuit,’ the 91-year-old judge delved into the complexities of the argument more thoroughly than any past court has. John Pappas was pleased with the result, and impressed with the methodology.

    The king nine offsuit chart he refers to is above. Simulated earnings for better players are shown on the left in blue, and earnings for not so good players are shown on the right. Although both groups are likely to lose with the hand, skill appears to decrease expected losses.

    Check out the full report here [pdf].

  • Josh Cothran looked at who’s paid for healthcare over the past five decades, with an animated Marimekko chart.

    In 1960, almost 100% of the spending on prescription drugs came out of the consumer’s pocket; by 2010, out-of-pocket spending was down to 20%. Over the past 50 years, there have been major shifts in the way hospital care, physician services, long-term care, prescription drugs, and other services and products are paid for. This interactive graphic uses data from the Centers for Medicare and Medicaid Services to show national spending trends from 1960 to 2010 for health care by payer.

    In case you’re unfamiliar with the layout, there are two visual dimensions to the Marimekko. On the vertical is percentage for the main categories: hospital care, physicians and clinical services, etc. On the horizontal is a breakdown of the main categories: private insurance, Medicare, etc. The animation brings time as a third dimension for which the overall size of the chart is constant, so pay attention to the changing relative percentages.

  • August 24, 2012

    Topic

    Maps  /  ,

    As megafires in the Southwest are becoming the new normal, NPR reports in a five-part series. An interactive map by Matt Stiles, Stephanie D’Otreppe and Brian Boyer provides a daily update on burning conditions across the country.

  • Edwin Chen, a data scientist at Twitter, took an in-depth look at what people are more inclined to tweet on Twitter and like on Facebook. He used FlowingData as his main data source, but also analyzed Quora, xkcd, and New Scientist. The main finding:

    Twitter is still for the techies: articles where the number of tweets greatly outnumber FB likes tend to revolve around software companies and programming. Facebook, on the other hand, appeals to everyone else: yeah, to the masses, and to non-software technical folks in general as well.

    I saw the analysis when it was posted over a year ago but never got around to sharing it. It crossed my desktop again recently. The results still seem to apply.

    From a practical standpoint, I don’t think about whether or not people are going to share something more on Twitter or Facebook before I post it. I just link to what I think is interesting. However, when I post something with a poop or fart joke in it (so half the time, basically), I make sure I share it on Facebook, which I have to do manually. Because you know, bowel movements have universal appeal.

  • Amazon used their book sales data to color a map red and blue.

    Our 2012 Election Heat Map colors each state according to the percentage of red and blue book purchases, based on shipping address, that have been made on Amazon.com during the past 30 days. We take the top-selling political books on Amazon.com and categorize them as “red,” “blue,” or neutral. We classify books as red or blue if they have a political leaning made evident in book promotion material and/or customer classification, such as tags. We compute percentages, updated daily, for each state and the US by comparing the 250 best-selling blue books during the time period against the 250 best-selling red books during the same time period, including new book launches.

    The country is practically colored all red, so there’s not a ton to glean from the map. Although I wonder what it’d look like at the county or city level. They should do that. I also wonder what other trends can come from Amazon sales data. They should do that, too.

  • Water Light Graffiti is an installation by Antonin Fourneau that lets you use water and light as your painting medium.

    The “Water Light Graffiti” is a surface made of thousands of LED illuminated by the contact of water. You can use a paintbrush, a water atomizer, your fingers or anything damp to sketch a brightness message or just to draw. Water Light Graffiti is a wall for ephemeral messages in the urban space without deterioration. A wall to communicate and share magically in the city.

    Pretty awesome how the wall illuminates when a couple of buckets of water are thrown at it.

    [via Co.Design]