• Membership
  • Newsletter
  • Projects
  • Learning
  • About
  • Member Login
  • Central limit theorem animation

    June 3, 2013

    Topic

    Statistical Visualization  /  animation, central limit theorem, D3

    The central limit theorem:

    In probability theory, the central limit theorem (CLT) states that, given certain conditions, the mean of a sufficiently large number of independent random variables, each with a well-defined mean and well-defined variance, will be approximately normally distributed.

    Victor Powell animated said random variables falling into a normal distribution (which should look familiar to those who have seen that ping pong ball exhibit in exploratoriums and science museums). Play around with the number of bins and delay time and watch it go.

  • Geography of tweets

    June 2, 2013

    Topic

    Maps  /  Twitter

    Twitter mapped all the geotagged tweets since 2009. There’s billions of them, so as you might expect, roads, city centers, and pathways emerge. And it only took 20 lines of R code to make the maps.

  • Guide to Arrested Development jokes →

    May 31, 2013

    Topic

    Infographics  /  Arrested Development, NPR

    In celebration of Arrested Development’s return via Netflix, NPR combed through the jokes — obvious and obscure — and set them in a handy interactive guide.

    Arrested Development is back! Because we’re obsessed we care about your watching enjoyment, we wrote down all the recurring gags in every episode — including the new season 4 episodes — with special attention to jokes hidden in the background (like Cloudmir vodka) or being foreshadowed (like when Buster lost his hand).

    The three categories of joke are color-coded, where each row represents a joke and a tick represents an occurrence of that joke over four seasons.

    I’ve only watched a handful of episodes, but I’m tempted to turn on Netflix with this guide in front of me. [Thanks, @onyxfish]

  • DDoS attack animation

    May 30, 2013

    Topic

    Visualization  /  animation, DDOS

    In distributed denial-of-service attack a bunch of machines make a bunch of requests to a server to make it buckle under the pressure. There was recently an attack on VideoLAN’s download infrastructure. Here’s what it looked like.


    Read More

  • Lego venn diagram →

    May 29, 2013

    Topic

    Infographics  /  humor, LEGO, venn diagram

    Profound.

  • Medicare provider charge data released

    May 28, 2013

    Topic

    Data Sources  /  health, medicare, New York Times, Washington Post

    NYT hospital browserThe Centers for Medicare and Medicaid Services released billing data for more than 3,000 U.S. hospitals, showing high variance in cost of health scare across the country and even between nearby hospitals.

    As part of the Obama administration’s work to make our health care system more affordable and accountable, data are being released that show significant variation across the country and within communities in what hospitals charge for common inpatient services.

    The data provided here include hospital-specific charges for the more than 3,000 U.S. hospitals that receive Medicare Inpatient Prospective Payment System (IPPS) payments for the top 100 most frequently billed discharges, paid under Medicare based on a rate per discharge using the Medicare Severity Diagnosis Related Group (MS-DRG) for Fiscal Year (FY) 2011. These DRGs represent almost 7 million discharges or 60 percent of total Medicare IPPS discharges.

    The data is downloadable as CSV or Excel files and is surprisingly usable and worth a look.

    The New York Times has a useful per-hospital browser and The Washington Post provides quick comparisons by state.

  • Personal data for sale

    May 27, 2013

    Topic

    Self-surveillance  /  Kickstarter, privacy

    NYU ITP graduate student Federico Zannier collected data about himself — online browsing, location, and keystrokes — for his thesis. As he dug into personal data more and looked closer at company privacy policies, he wondered what it might be like if individuals profited from their own data. That is, companies make money using the data we passively generate while we browse and use applications and visit sites. What if individuals owned that data and were able to sell it?

    Enter Zannier’s Kickstarter campaign to sell his own data for $2 per day of activity.

    I started looking at the terms of service for the websites I often use. In their privacy policies, I have found sentences like this: “You grant a worldwide, non-exclusive, royalty-free license to use, copy, reproduce, process, adapt, modify, publish, transmit, display and distribute such content in any and all media or distribution methods (now known or later developed).” I’ve basically agreed to give away a lifelong, international, sub-licensable right to use my personal data.

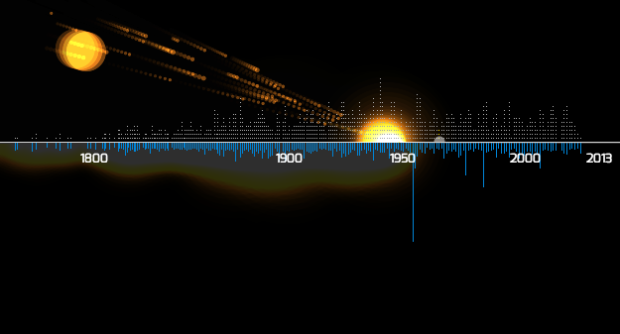
    Somebody told me that we live in the data age, that the silicon age is already over. “In this new economy,” they said, “data is the oil.”

    Well, this is me trying to do something about it.

    Clearly this is more of a statement and conversation starter, but what if?

    There’s about a week left in the campaign, and it’s well past the goal.

  • The Art of Data Visualization

    May 24, 2013

    Topic

    Visualization  /  Edward Tufte, Jer Thorp, PBS, video

    PBS Off Book’s recent episode is on “the art of data visualization.” It feels like a TED talk — kind of fluffy and warm — with several names and visualization examples that you’ll recognize. No clue who the first guy is though.

  • Sensory augmentation device

    May 23, 2013

    Topic

    Data Art  /  augmentation

    We’ve seen plenty of augmented reality where you put on some digitally-enabled glasses or point your camera phone on something and visuals are overlaid on reality. The augmentation is typically a layer on top.

    Eidos is a student project that tries taking this in a different direction. One piece applies an effect similar to long-exposure photography, and the other sends audio to your inner ear to focus on a subject and drown out ambient noise. See the devices in action in the video below.

    [via FastCo]

  • Meteorites seen falling since 2500BC visualized

    May 22, 2013

    Topic

    Visualization  /  animation, meteorites

    About 35,000 meteorites have been recorded since 2500 BC, and a little over 1,000 of them were seen while they fell, based on data from the Nomenclature Committee of the Meteoritical Society. Carlo Zapponi, a data visualization designer, visualized the latter in Bolides.

    We saw a mapped version of this data a while back, but Bolides takes a time-based approach. A bar chart shows the number and volume of meteorites that have been seen over time, and on the initial load, you get to watch the meteorites fall, one bright orange fireball at a time.

  • A quarter century of satellite imagery

    May 21, 2013

    Topic

    Maps  /  Google, USGS

    In collaboration between USGS, NASA and TIME, Google released a quarter century of satellite imagery to see how the world has changed over time.

    The images were collected as part of an ongoing joint mission between the USGS and NASA called Landsat. Their satellites have been observing earth from space since the 1970s—with all of the images sent back to Earth and archived on USGS tape drives that look something like this example (courtesy of the USGS).

    We started working with the USGS in 2009 to make this historic archive of earth imagery available online. Using Google Earth Engine technology, we sifted through 2,068,467 images—a total of 909 terabytes of data—to find the highest-quality pixels (e.g., those without clouds), for every year since 1984 and for every spot on Earth. We then compiled these into enormous planetary images, 1.78 terapixels each, one for each year.

    Be sure to check out the Timelapse feature on Time.

  • Convergence of Miss Korea faces

    May 20, 2013

    Topic

    Statistics  /  Korea, plastic surgery

    After seeing a Reddit post on the convergence of Miss Korea faces, supposedly due to high rates of plastic surgery, graduate student Jia-Bin Huang analyzed the faces of 20 contestants. Below is a short video of each face slowly transitioning to the other.

    From the video and pictures it’s pretty clear that the photos look similar, but Huang took it a step further with a handful of computer vision techniques to quantify the likeness between faces. And again, the analysis shows similarity between the photos, so the gut reaction is that the contestants are nearly identical.

    However, you have to assume that the pictures are accurate representations of the contestants, which doesn’t seem to pan out at all. It’s amazing what some makeup, hair, and photoshop can do.

    You gotta consider your data source before you make assumptions about what that data represents.

  • Coaches are highest paid public employees

    May 17, 2013

    Topic

    Maps  /  Deadspin

    Deadspin made a straightforward map that shows the highest paid public employee in each state.

    Based on data drawn from media reports and state salary databases, the ranks of the highest-paid active public employees include 27 football coaches, 13 basketball coaches, one hockey coach, and 10 dorks who aren’t even in charge of a team.

  • Ratings of TV shows over time

    May 16, 2013

    Topic

    Statistical Visualization  /  ggplot, Shiny, television

    The quality of television shows follow all kinds of patterns. Some shows stink in the beginning and slowly gain steam, whereas others are great at first and then lost momentum towards eventual cancellation. Using data from the Global Episode Opinion Survey, Andrew Clark visualized ratings over time for many popular shows in an interactive.
    Read More

  • Page 239 of 392
  • <
  • 1
  • ...
  • 236
  • 237
  • 238
  • 239
  • 240
  • 241
  • ...
  • 392
  • >

Analyze, visualize, and communicate data usefully, beyond the defaults.

Become a member →

Recently for Members

May 15, 2025
Step Chart, Enhanced

May 8, 2025
When the data is not what it seems

May 1, 2025
Finding the Right Charts

April 24, 2025
Visualization Tools, Datasets, and Resources – April 2025 Roundup

April 17, 2025
Breaking Out of Chart Software Defaults

Browse by Chart Type See All →

Frequency Trails Glyph Chart Ternary Plot Moving Bubbles Cartogram Spike Map Alluvial Diagram Parallel Sets Stacked Area Chart Slope Chart

Browse By Topic

  • Visualization

    Seeing data

  • Maps

    Seeing geographic data

  • Infographics

    Explaining data

  • Networks

    Connecting data

  • Statistics

    Analyzing data

  • Software

    Working with data

  • Sources

    Getting data

  • Design

    Making data readable

Get the Book

Visualize This: The FlowingData Guide to Design, Visualization, and Statistics

Available now.

Order: Amazon / Bookshop

Made by FlowingData

  • The Process

  • Data Underload

  • Chart Everything

  • Guides

  • Books

  • Shop

  • About
  • Contact
  • Newsletter
  • LinkedIn
  • Instagram
  • Bluesky
  • RSS
Copyright © 2007-Present FlowingData. All rights reserved.