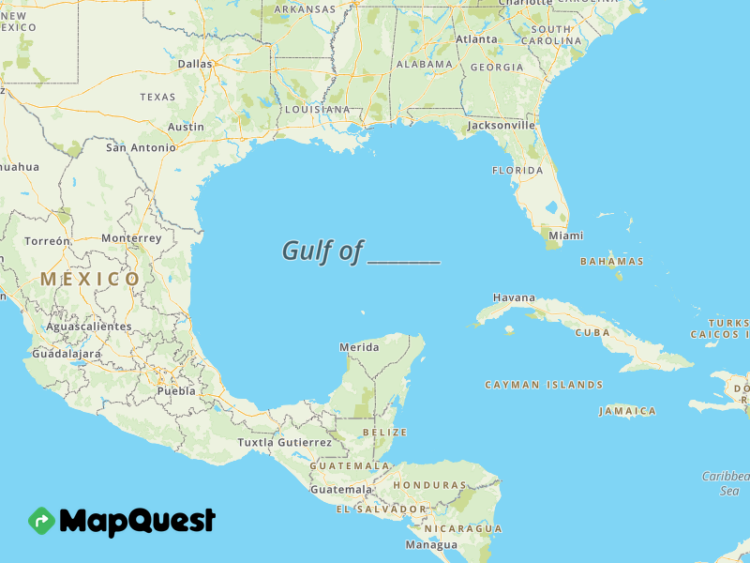
Most of the major map providers changed the name. MapQuest had a different idea. Enter whatever you want and download. (Their standard map still reads the Gulf of Mexico.)
Most of the major map providers changed the name. MapQuest had a different idea. Enter whatever you want and download. (Their standard map still reads the Gulf of Mexico.)
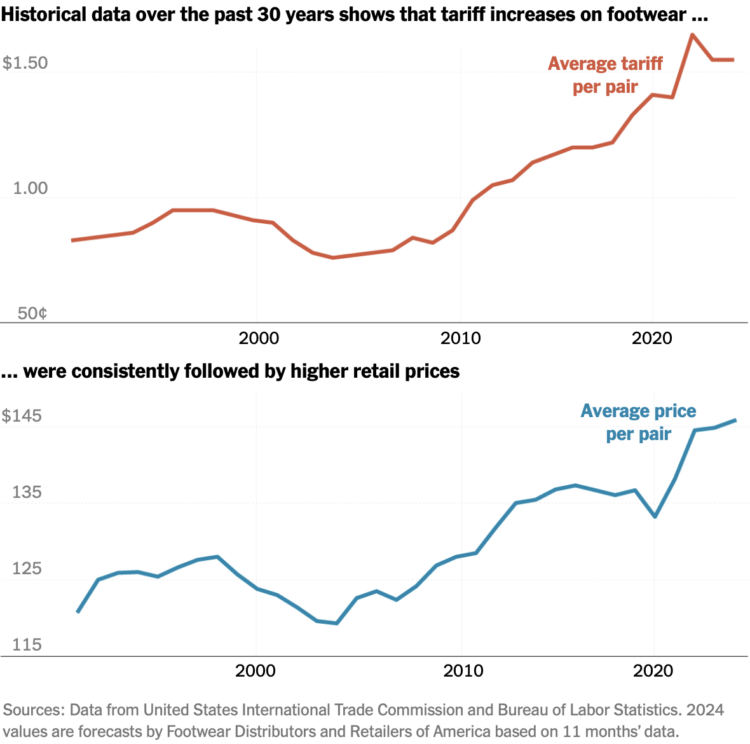
I think I’ve read about tariffs more in the past month than I have my entire life. They’ve been pitched as a cure-all to make countries give into U.S. demands. As you might expect, the effects are not so straightforward or predictable. For The New York Times, June Kim describes various scenarios with a shoe example, as most shoes bought in the U.S. are made elsewhere.
The DOGE site has a “wall of receipts” that claims $55 billion in federal government savings. However, as noted by NYT’s the Upshot, a large line item, since removed, showed a contract for $8 billion (with a ‘b’) that should’ve been $8 million (with an ‘m’):
Almost half of those line-item savings could be attributed to a single $8 billion contract for the Immigration and Customs Enforcement agency. But it appears that the DOGE list vastly overstated the actual intended value of that contract. A closer scrutiny of a federal database shows that a recent version of the contract was for $8 million, not $8 billion. A larger total savings number published on the site, $55 billion, lacked specific documentation.
Everyone makes mistakes, but it seems out of bounds when coupled with firings, takedowns, budget cuts, and all the other stuff.

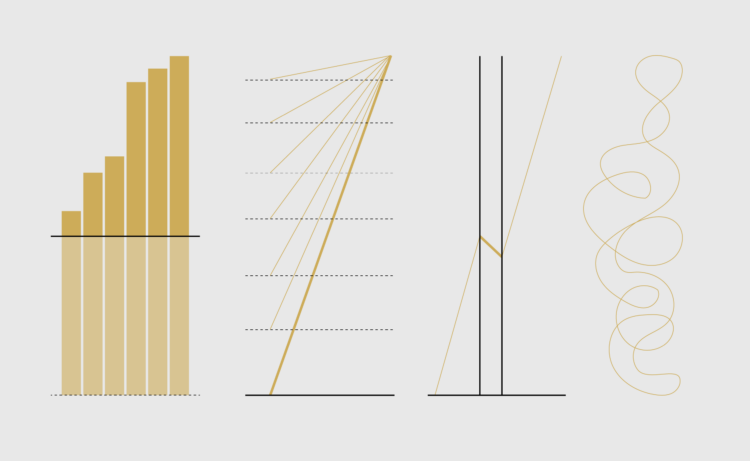
With color as the visual encoding, choose the scales that allow you to see actual patterns.
The administration continues its takedown of data that it doesn’t agree with. To get ahead of the wave, if by just a little, Andrew Van Dam for Washington Post’s Department of Data charted datasets that might disappear soon.
The Department of Government Efficiency claims data in the Social Security Administration database shows 150-year-olds receiving benefits. Probably not. For Wired, David Gilbert reports:
Because COBOL does not have a date type, some implementations rely instead on a system whereby all dates are coded to a reference point. The most commonly used is May 20, 1875, as this was the date of an international standards-setting conference held in Paris, known as the “Convention du Mètre.”
These systems default to the reference point when a birth date is missing or incomplete, meaning all of those entries in 2025 would show an age of 150.
That’s just one possible explanation for what DOGE allegedly found. Musk could also have simply looked up the SSA’s own website, which explains that since September 2015 the agency has automatically stopped benefit payments when anyone reaches the age of 115.
Is it feigned ignorance? It’s hard to believe that someone with Musk’s status would take data at face value.
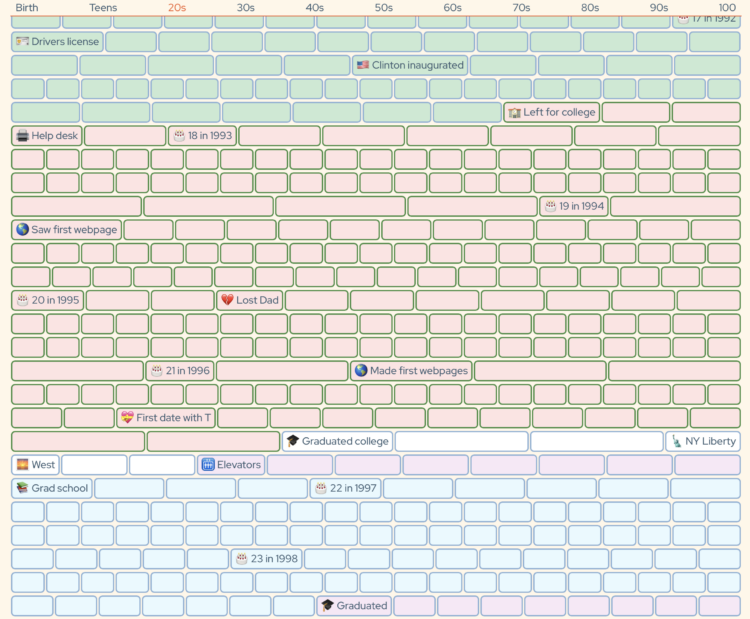
Coming up on 50 years old, Gina Trapani mapped out her life so far in one-week segments. Colors indicate decades and significant moments in time get text. The timeline is at 49 years old and goes up to 100.
This is great. It’s a way to remember and a way to look forward.
Robert Santos, who resigned last month, wrote a heartfelt open letter to Census Bureau workers:
Now, a transition of administrations has occurred as part of our republic’s democratic process. Uncertainty and stress abound. Events are unfolding rapidly. Families are suffering. As a nascent former director, please know that I feel your pain. And in all honestly, stormy weather lies ahead. Yet, the Census Bureau’s mission remains as a beacon of hope.
During my service, I saw that the Bureau’s career staff benefit from four sources of strength. First is your intense dedication to mission. You are leaders in providing quality statistical data about our nation’s people and economy and do this exceptionally well. Each staff person makes their unique contribution towards the mission. Our country needs that more than ever. Second are the Bureau’s organizational values of scientific integrity, objectivity, transparency and independence. These are powerful tools to guide decision making. Third is your profound resilience. You demonstrated to the world that a quality decennial census could be conducted in the midst of a deadly global pandemic. That resilience remains with you, and you’ll again need to draw upon it. Lastly, you have each other. The bonds of colleagueship run deep at the Bureau and are a great source of strength. Beyond these, please understand that there are many, many communities of external stakeholders (me included) who actively advocate for you and the federal statistical community. Stakeholders represent a robust source of strength, and I pray they provide a measure of comfort in these challenging times.
For the Washington Post, Jacob Bogage and Jeff Stein report:
Under pressure from the White House, the IRS is considering a memorandum of understanding that would give officials from DOGE — which stands for Department of Government Efficiency — broad access to tax-agency systems, property and datasets. Among them is the Integrated Data Retrieval System, or IDRS, which enables tax agency employees to access IRS accounts — including personal identification numbers — and bank information. It also lets them enter and adjust transaction data and automatically generate notices, collection documents and other records.
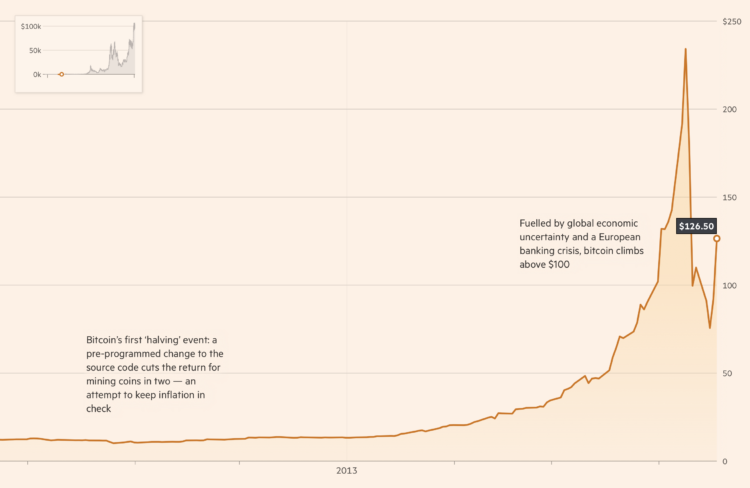
There was a moment a few years ago when cryptocurrency was mentioned everywhere you went. Then it faded for a while. But now it’s kind of back. With the new administration, Financial Times (paywalled) charted bitcoin’s fluctuations. They used a scrolly format that shows a fixed window of time as you go. I like the small thumbnail that keeps you oriented in the timeline.

From the outsider point of view, a path towards collision might seem obvious, but things look different from a pilot’s point of view at night. The New York Times built a 3-D model to visualize what the Black Hawk pilots might have seen before the crash with a commercial plane.
The Times analysis also indicates that the pilots’ view of the ground and river below would not have drastically changed to offer a visual cue that their helicopter had temporarily drifted into an unsafe path, above the authorized altitude in this area. Whether the Black Hawk’s instruments gave the pilots any indication that they were flying higher than authorized is unclear.
The maps and animation, just short of a flight simulator game, illustrate why the reasons for the crash aren’t so obvious.
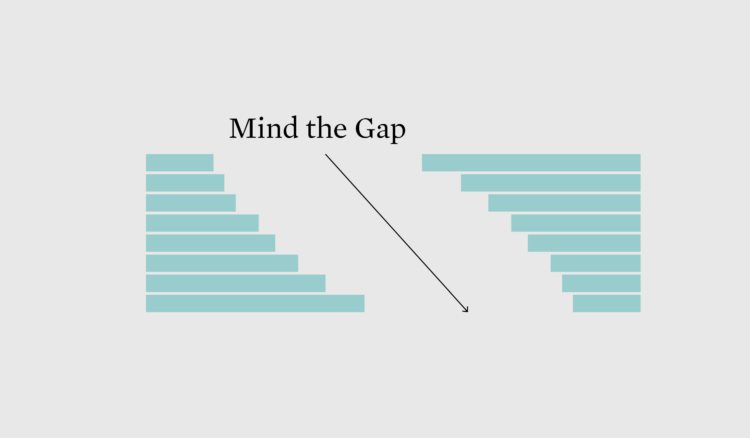
How do we visualize the data that isn’t there or new estimates that arise when methodology changes?
Charts are a window into the world. When done right, we gain an understanding of who we are, where we are, and how we can become better versions of ourselves. However, when done wrong, in the absence of truth, charts can be harmful.
This is a guide to protect ourselves and to preserve what is good about turning data into visual things.
We start with chart anatomy; then we look at how small changes can shift a point of view; this takes us to misleading chart varieties; and we finish with reading data and next steps.
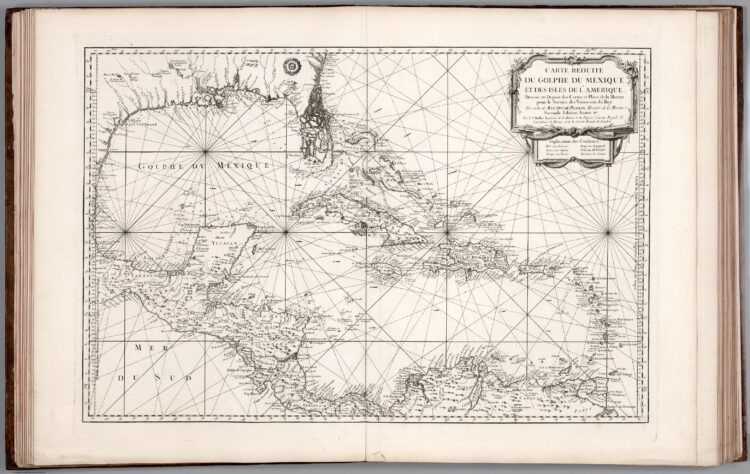
After a gulf rename, I got to browsing some historical maps. Jacques Nicolas Bellin drew this map in 1765.
This is not the first mention for the Gulf of Mexico though. That belongs to a map from 1550, according to Paul Galtsoff’s article (1954) for Fish and Wildlife Service:
Cortes, in his despatches, referred to the Gulf as Mar del Norte, while the names Golfo de Florida and Golfo de Cortes are found in the writings of other explorers. The name Sinus Magnus Antilliarum appears on an old Portuguese map made in 1558 by Diego Homen (original in British Museum). Probably the most remarkable name is that of Mare Cathaynum (Chinese Sea) which is found on one chart of the middle of the sixteenth century (copy reproduced in the Memoirs de la Societe de Nancy, 1832). In 1550 the name Golfo de Mexico appears for the first time on the world map the original of which, according to Kohl, is in the Bodleian Library in Oxford. Earlier Spanish geographers used, also, the name of Golfo de Nueva Espana. Herrera (1728) called it Ensenada Mexicana and Seno Mexicano, the names which persisted in Spanish admiralty charts until the eighteenth century. The present name, the Gulf of Mexico, and the corresponding names, Golphe du Mexique in French and Golfo Mexicano in Spanish, appear to have been in use since the middle of the seventeenth century.
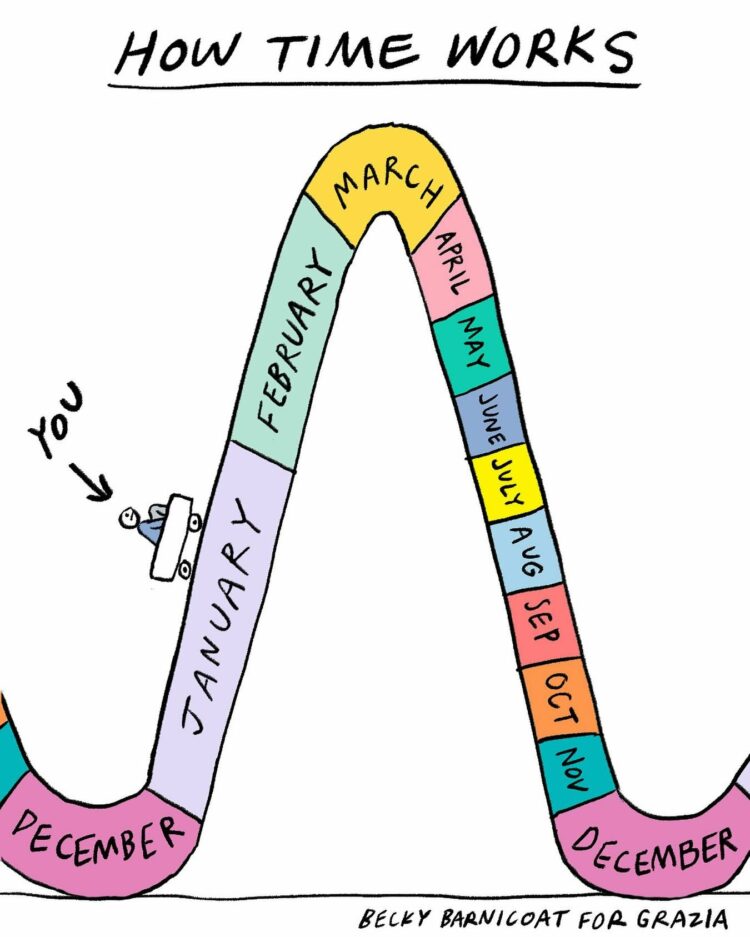
Cartoonist Becky Barnicoat illustrates the passing of time over a year. Seems right:
While government data remains in limbo, for Slate, Lizzie O’Leary highlights the sectors that rely on public resources (all of them):
Government data is certainly not perfect, true. But the private sector relies heavily on government information. Economists Ellen Hughes-Cromwick and Julia Coronado wrote a 2019 paper published in the Journal of Economic Perspectives showing how a vast range of companies depend on U.S. government data to understand their customers and make decisions about how to run their businesses.
Let’s say that you run, oh, I don’t know, an electric car company. According to Hughes-Cromwick and Coronado’s work, you might use government reports on auto sales (the Bureau of Economic Analysis), consumer credit (the Fed), the consumer price index for new vehicles (BLS), the consumer price index for all items (BLS), disposable personal income (BEA), employment and unemployment (BLS), energy prices (BLS and the Energy Information Administration), the GDP (BEA), interest rates (the Fed), inventories (the census), regional income, prices, and consumer spending (BEA and the census). And that’s just for short-term decisionmaking purposes!

The “Department of Government Efficiency” wants to cut $2 trillion from the federal budget. For The Washington Post, Luis Melgar, Emma Kumer, and Jeff Stein use a quiz-like graphic to show why such a cut is a lofty task. Choose what to cut and see if you can reach the target amount.
You can use the Internet Archive to access historical versions, but GovWayback makes it even more straightforward:
GovWayback is a simple tool to quickly access archived versions of government websites from before January 20, 2025 – just add “wayback.com” after “.gov” in any government URL. GovWayback automatically redirects you to that page’s archived version from the Internet Archive.
For example, you can enter cdc.govwayback.com, and it’ll take you the archived version of cdc.gov.
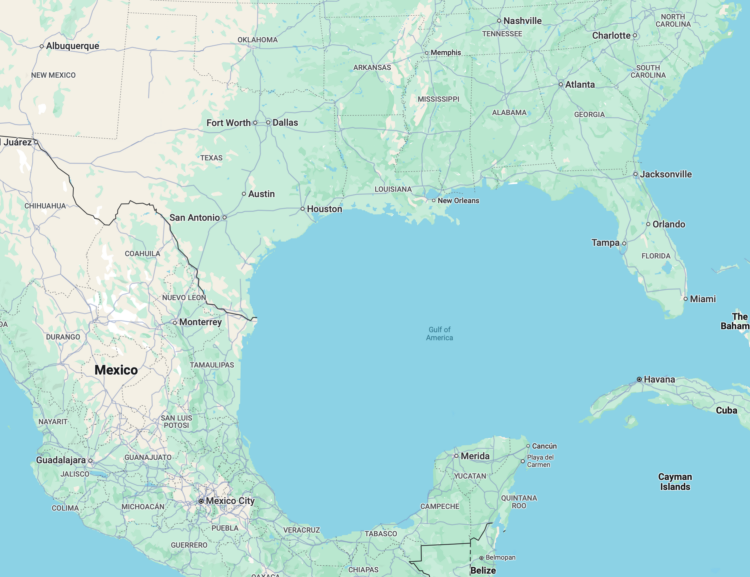
The Gulf of Mexico has been renamed to the Gulf of America in the Geographic Names Information System (GNIS) by the U.S. Geological Survey. When you search for the gulf on USGS, you get the following result that defaults to Gulf of America.
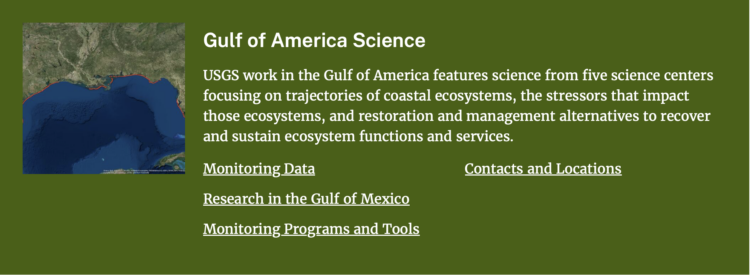
Only the main title changed though. “Research in the Gulf of Mexico” appears underneath and if you follow the link, Mexico is the point of reference.
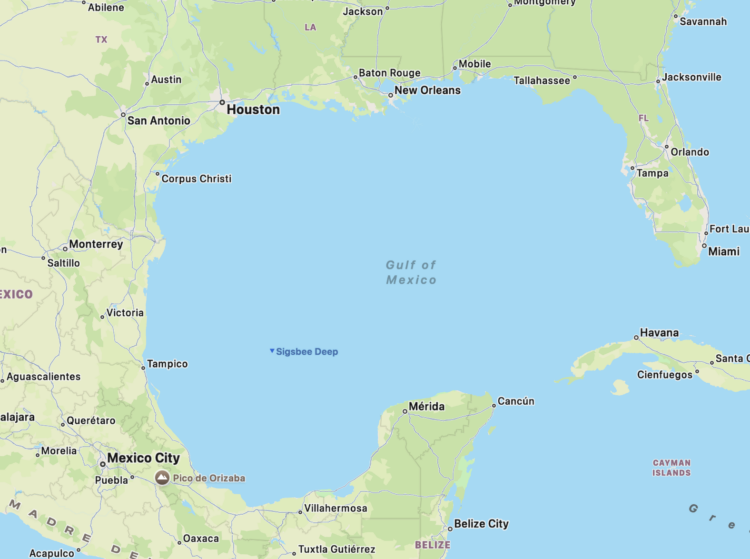
But now, when you search Google Maps, which follows the naming defined by the GNIS, you get the Gulf of America, as shown above. As of the evening of February 10, 2025, Apple Maps still shows the Gulf of Mexico:
It’s shocking how quickly the names can change in the system. The GNIS started in the 1970s. How many times have geographic areas and features changed over the years? Is there a space that has been renamed many times?
In the U.S., the Geographic Names Information System (GNIS) has officially updated “Gulf of Mexico” to “Gulf of America.” As we announced two weeks ago and consistent with our longstanding practices, we’ve begun rolling out changes to reflect this update. People using Maps in the U.S. will see “Gulf of America,” and people in Mexico will see “Gulf of Mexico.” Everyone else will see both names.

I honestly thought this was a joke.
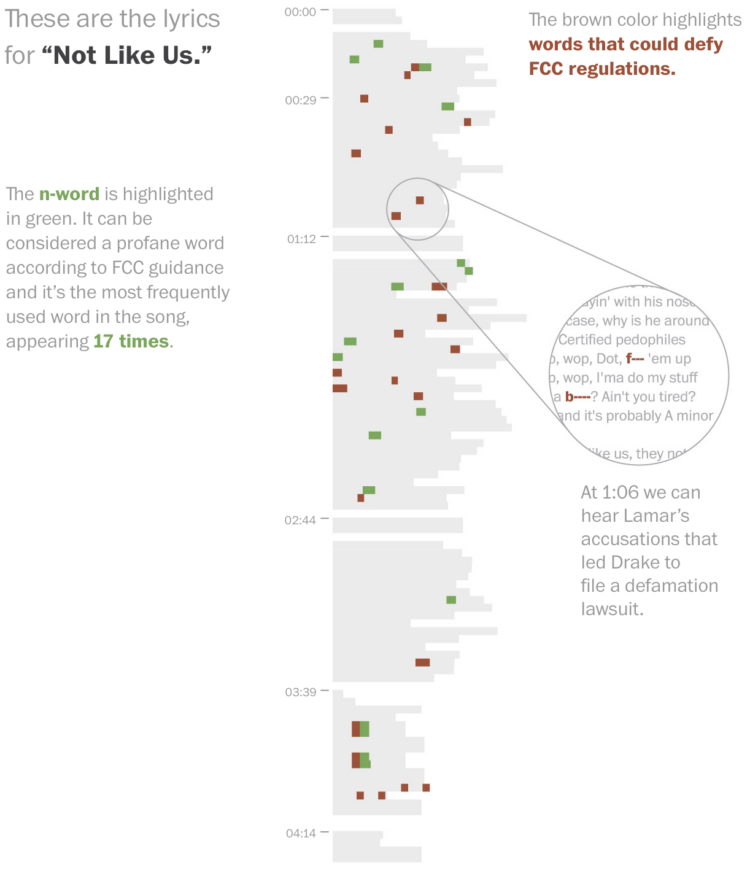
I missed this one last week, pre-Super Bowl, but for The Washington Post, Artur Galocha highlighted self-censoring during the Super Bowl halftime show to comply with FCC regulations. It seems Kendrick Lamar was still able to get his point across with lyric substitutions.
 Visualize This: The FlowingData Guide to Design, Visualization, and Statistics (2nd Edition)
New tools, refined process.


